
A/B Testing 101: A Beginner's Guide
Introduction
In the world of data-driven decision making, A/B testing stands as one of the most powerful tools for optimization and growth. Whether you’re running a website, developing a mobile app, crafting marketing campaigns, or designing products, A/B testing provides a scientific method to understand what truly works for your audience. This comprehensive guide will walk you through everything you need to know to get started with A/B testing, from fundamental concepts to practical implementation strategies.
What Is A/B Testing?
The Basic Definition
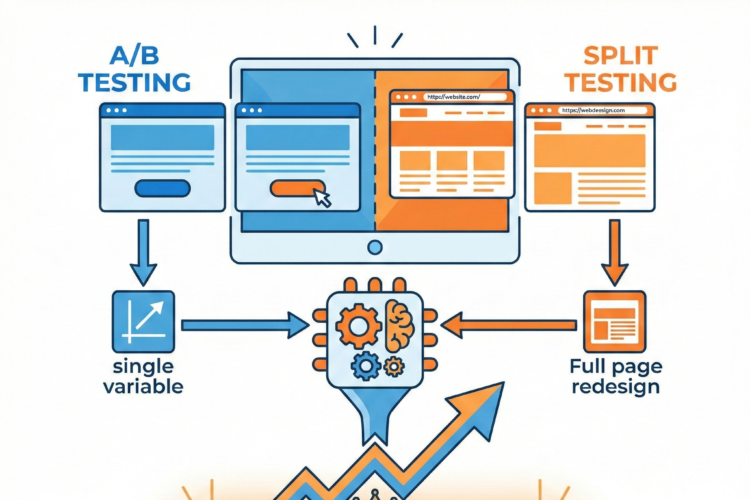
A/B testing, also known as split testing, is a randomized experiment that compares two versions of something to determine which performs better. In its simplest form, you create two variants:
- Version A (Control): The current or original version
- Version B (Variant): The modified version with one or more changes
You then split your audience randomly between these versions and measure which one achieves better results based on predefined success metrics. The beauty of A/B testing lies in its simplicity and scientific rigor—it removes guesswork and personal bias from decision-making, letting real user behavior guide your choices.
Why A/B Testing Matters
Data Over Opinions
Every business faces countless decisions about design, copy, features, and user experience. Without testing, these decisions are often based on:
- Personal preferences of the highest-paid person’s opinion (HiPPO)
- Industry best practices that may not apply to your specific audience
- Assumptions about user behavior that haven’t been validated
- Designer or developer preferences rather than user needs
A/B testing replaces assumptions with evidence, showing exactly how changes impact user behavior and business outcomes.
Incremental Improvements Compound
Small improvements add up significantly over time. A 2% improvement in conversion rate might seem modest, but compounded across thousands or millions of users, it can translate to substantial revenue increases, cost savings, or user engagement improvements.
Risk Mitigation
Testing changes before full rollout prevents costly mistakes. If a new design or feature actually decreases conversions or user satisfaction, you discover this with a small portion of your audience rather than impacting everyone.
Learning About Your Audience
Beyond immediate wins, A/B testing teaches you how your specific audience thinks and behaves, building institutional knowledge that informs future decisions across all areas of your business.
Core Concepts and Terminology
Key Terms You Need to Know
Control and Variant
The control is your baseline—typically the existing version. The variant is the version with your proposed change. You can test multiple variants (A/B/C/D testing), but we’ll focus on simple A/B tests for this guide.
Hypothesis
Before running any test, you should have a clear hypothesis: a prediction about what will happen and why. A good hypothesis follows this format: “If we [make this change], then [this metric] will [increase/decrease] because [reasoning based on user behavior or psychology].”
Example: “If we change the call-to-action button from green to orange, then click-through rate will increase because orange creates more visual contrast with our blue background, making the button more noticeable.”
Conversion
A conversion is any desired action you want users to take: making a purchase, signing up for a newsletter, clicking a button, completing a form, downloading content, or any other meaningful goal.
Conversion Rate
The percentage of users who complete your desired action. Calculated as: (Number of conversions / Total number of visitors) × 100
Statistical Significance
A measure of whether your results are likely due to the changes you made rather than random chance. Typically, we aim for 95% confidence, meaning there’s only a 5% probability the results occurred by chance.
Sample Size
The number of users included in your test. Larger sample sizes generally provide more reliable results, but the required size depends on your baseline conversion rate and the size of improvement you’re trying to detect.
Test Duration
How long you run your test. Duration impacts sample size and helps account for day-of-week effects and other temporal variations in user behavior.
Understanding Statistical Significance
This is one of the most important concepts in A/B testing. Imagine flipping a coin three times and getting three heads. You wouldn’t conclude the coin is biased—you’d recognize that with small samples, you can get streaks by pure chance.
The same principle applies to A/B testing. If variant B shows higher conversions with just 50 users per version, that difference might easily be random fluctuation. Statistical significance tells you when you can be confident the difference is real.
Most A/B testing tools calculate this automatically, but understanding the concept helps you interpret results correctly and avoid common mistakes like stopping tests too early or misinterpreting marginal differences.
What Can You A/B Test?
Website Elements
Headlines and Copy
Words matter tremendously. Test different:
- Value propositions
- Headline formulations
- Body copy length (long versus short)
- Tone and voice (formal versus casual)
- Technical versus benefit-focused language
- Question-based versus statement-based headlines
Call-to-Action (CTA) Buttons
Small changes to CTAs can drive significant impact:
- Button text (“Buy Now” vs. “Add to Cart” vs. “Get Started”)
- Button color and contrast
- Button size and shape
- Button placement on the page
- Number of CTAs (single versus multiple)
Images and Visuals
Visual elements strongly influence user perception:
- Hero images (people versus products versus abstract)
- Image presence versus absence
- Video versus static images
- Number of images
- Image size and placement
Page Layout and Structure
How you organize information affects comprehension and action:
- Single-column versus multi-column layouts
- Navigation structure and menu design
- Information hierarchy
- Form length and field arrangement
- Content placement (above versus below fold)
Forms
Forms are critical conversion points worth extensive testing:
- Number of form fields (each field typically decreases completion)
- Field labels (above versus beside fields)
- Required versus optional fields
- Single-page versus multi-step forms
- Privacy statements and trust signals
- Progress indicators for multi-step forms
Navigation and Site Structure
How users move through your site impacts everything:
- Menu organization and categorization
- Breadcrumb implementation
- Search functionality prominence
- Footer content and organization
- Internal linking strategies
Email Campaigns
Subject Lines
Often the most important element determining whether emails get opened:
- Length (short versus long)
- Personalization (including name versus generic)
- Emoji usage
- Urgency indicators
- Question versus statement format
- Specificity versus curiosity gap
Send Times
When you send can matter as much as what you send:
- Day of week
- Time of day
- Timezone optimization for global audiences
- Relationship to user activity patterns
Email Design
Visual presentation affects engagement:
- Plain text versus HTML
- Image-heavy versus text-heavy
- Single-column versus multi-column
- CTA button design and placement
- Personalization elements
Content and Messaging
What you say and how you say it:
- Content length
- Promotional versus educational content
- Story-based versus feature-focused
- Tone and voice variations
- Offer presentation
Mobile Apps
Onboarding Flows
First impressions shape retention:
- Number of onboarding screens
- Content on each screen
- Skip option availability
- Value proposition presentation
- Account creation timing (immediate versus delayed)
Feature Presentation
How users discover functionality:
- Tutorial presence and format
- Tooltips and in-app guidance
- Feature discoverability through UI design
- Progressive disclosure strategies
Push Notifications
Timing and messaging for engagement:
- Notification frequency
- Message content and tone
- Personalization approaches
- Timing relative to user actions
- Rich notification formats
Pricing and Offers
Price Points
Finding optimal pricing through testing:
- Absolute price levels
- Price ending strategies ($.99 versus $1.00)
- Pricing tier structures
- Discount presentation (percentage versus dollar amount)
Trial and Freemium Models
Conversion funnel optimization:
- Trial duration (7 days versus 14 days versus 30 days)
- Credit card requirement timing
- Feature limitations in free versions
- Upgrade prompts and messaging
The A/B Testing Process: Step by Step
Step 1: Research and Identify Opportunities
Don’t test randomly. Start by gathering data about where problems or opportunities exist:
Analyze Current Performance
Use analytics tools to identify:
- Pages with high traffic but low conversions
- High bounce rate pages
- Forms with low completion rates
- Steps in funnels where users drop off
- User flow bottlenecks
Gather Qualitative Feedback
Numbers tell you what’s happening, but not why:
- User surveys asking about pain points
- Customer support tickets revealing common issues
- Session recordings showing user struggles
- Heatmaps displaying attention and interaction patterns
- User testing sessions identifying confusion points
Conduct Competitive Analysis
See what others in your space are doing (but don’t blindly copy):
- Competitor design and messaging approaches
- Industry standard practices
- Innovative approaches that might apply to your context
Prioritize Testing Opportunities
With limited resources, focus on changes that offer:
- High potential impact (significant difference if successful)
- High traffic volume (faster to reach significance)
- Alignment with business goals
- Feasibility of implementation
Use frameworks like PIE (Potential, Importance, Ease) to score and prioritize testing ideas.
Step 2: Develop Your Hypothesis
Transform observations into testable predictions. A strong hypothesis includes:
Current Observation
What’s happening now: “Our checkout page has a 45% abandonment rate, and heatmaps show users aren’t scrolling to see security badges at the bottom.”
Proposed Change
What you’ll modify: “Move security badges and trust signals from the footer to directly beside the payment form.”
Expected Outcome
What metric will change: “Checkout completion rate will increase.”
Reasoning
Why you believe this will work: “Users need reassurance about payment security at the point of making the payment decision, and research shows trust signals reduce abandonment when placed near conversion points.”
Full Hypothesis Example
“If we move security badges from the checkout page footer to beside the payment form, then checkout completion rate will increase by at least 5% because users will see trust signals at the moment they’re making the security assessment, reducing anxiety-driven abandonment.”
Step 3: Create Your Variants
Design the Control
Your control is typically your existing version, unchanged. Document exactly what it includes so you have a clear baseline.
Create the Variant
Make your proposed change. Critical principles:
Test One Variable at a Time: If you change the headline AND the button color AND the image simultaneously, you won’t know which change drove any results you see. Isolate variables to learn what specifically works.
Make Changes Significant Enough to Matter: Tiny changes (slightly different shade of blue) rarely produce measurable differences. Your variant should be meaningfully different.
Ensure Technical Equivalence: Both versions should load at the same speed, work on all devices, and function identically except for the element being tested.
Quality Check Everything
Before launching, verify:
- All links work in both versions
- Forms submit correctly
- Pages display properly on mobile and desktop
- Analytics tracking is implemented correctly
- No technical errors exist in either variant
Step 4: Determine Sample Size and Duration
Calculate Required Sample Size
Several factors determine how many users you need:
Baseline Conversion Rate: Tests on pages with 50% conversion rates reach significance faster than those with 2% rates, simply because more conversions occur more quickly.
Minimum Detectable Effect: The smallest improvement you care about detecting. Detecting a 50% improvement requires fewer users than detecting a 5% improvement.
Statistical Power: Typically set at 80%, meaning you have an 80% chance of detecting a real difference if one exists.
Significance Level: Usually 95%, meaning you’re willing to accept a 5% chance of false positives.
Most A/B testing tools include sample size calculators where you input these parameters to determine required user counts.
Estimate Test Duration
Divide your required sample size by your daily traffic to estimate days needed. Then adjust for:
Weekly Cycles: Always run tests for complete weeks (multiples of 7 days) to account for day-of-week variations. Monday behavior often differs from Saturday behavior.
Business Cycles: For B2B sites, account for monthly business cycles (beginning versus end of month). For retail, consider seasonal shopping patterns.
Minimum Duration: Even with high traffic, run tests at least one full week to capture behavioral variations.
Maximum Duration: Tests running multiple weeks risk external factors (holidays, news events, marketing campaigns) contaminating results.
Step 5: Launch Your Test
Technical Setup
Using your chosen A/B testing tool:
- Configure traffic split (usually 50/50 for simple A/B tests)
- Set up conversion goal tracking
- Define audience targeting if needed
- Implement the test code or configuration
Pre-Launch Checklist
Before going live, verify:
- [ ] QA completed on both variants
- [ ] Tracking is properly implemented and firing
- [ ] Sample size and duration calculations are complete
- [ ] Stakeholders are informed about the test
- [ ] Documentation exists explaining the hypothesis and setup
Monitor Initial Performance
In the first hours/days, check:
- Traffic is splitting correctly between variants
- No technical errors are occurring
- Conversion tracking is working
- No unexpected user experience issues
Step 6: Monitor the Test (But Don’t Peek Too Much)
Let It Run
One of the biggest mistakes beginners make is stopping tests too early. Resist the temptation to check results constantly and declare victory (or defeat) prematurely.
Why Early Results Are Unreliable
In the early stages of a test, you haven’t reached statistical significance. What looks like a clear winner might reverse as more data accumulates. Random variation can create misleading patterns with small samples.
Appropriate Monitoring
You should check:
- Daily technical functionality (both versions working)
- That traffic continues flowing to the test
- No external factors are contaminating results (marketing campaigns launched, site-wide issues, seasonal events)
You shouldn’t:
- Check statistical significance multiple times per day
- Stop the test as soon as significance is reached (unless you’ve hit your predetermined sample size)
- Make premature decisions based on partial data
When to Stop Early
Only stop a test before completion if:
- A critical technical error is discovered
- The variant is causing serious business problems (security issues, legal concerns, customer complaints)
- External factors make the test invalid (major site changes, marketing campaigns that affect tested pages)
Step 7: Analyze Results
Check Statistical Significance
Your testing tool will typically show whether results are statistically significant. Look for:
- Confidence level (aim for 95% or higher)
- P-value (should be 0.05 or lower)
- Confidence intervals (ranges within which the true effect likely falls)
Understand Possible Outcomes
Clear Winner (Statistically Significant Improvement): The variant performed better with high confidence. You can implement the change.
Clear Loser (Statistically Significant Decrease): The variant performed worse. Don’t implement it, but you’ve learned something valuable about what doesn’t work.
No Significant Difference: Neither version clearly outperformed the other. This is a valid result indicating your change didn’t impact behavior as expected. Don’t implement the change, but you’ve avoided wasting resources on ineffective modifications.
Inconclusive (Insufficient Data): You didn’t reach statistical significance and the test ended (usually due to time constraints or traffic limitations). You can’t draw firm conclusions. Consider running a longer test with the same hypothesis.
Segment Your Data
Overall results tell only part of the story. Analyze performance across segments:
- Device type: Mobile versus desktop often show different patterns
- Traffic source: Organic search, paid ads, email, and social may respond differently
- New versus returning visitors: Different experience levels affect behavior
- Geographic location: Regional preferences can vary significantly
- Time-based: Different days of week or times of day might show patterns
Segmentation can reveal that a change works excellently for mobile users but poorly for desktop, or that new visitors respond differently than returning customers.
Calculate Practical Significance
Statistical significance tells you a difference exists, but is that difference meaningful for your business?
If your variant increased conversions by 0.5% with statistical significance but implementation requires significant engineering resources, the improvement might not justify the cost. Consider the practical business impact alongside statistical metrics.
Step 8: Implement and Document
Roll Out Winners
When you have a statistically significant winner with practical business value:
- Implement the change for all users
- Document what was changed and why
- Update any related documentation or style guides
- Inform relevant teams about the change
Document Everything
Maintain a testing knowledge base including:
- Hypothesis: What you predicted and why
- Test design: Exact changes made
- Results: Conversion rates, significance levels, lift percentages
- Learnings: Insights gained beyond just win/loss
- Next steps: Future test ideas generated by this experiment
This documentation becomes invaluable institutional knowledge, preventing teams from retesting the same hypotheses and building understanding of what works for your specific audience.
Share Learnings
Communicate results to stakeholders and teams:
- Marketing teams can apply messaging insights to campaigns
- Product teams can use UX learnings for feature development
- Design teams can incorporate successful patterns into other pro
Author