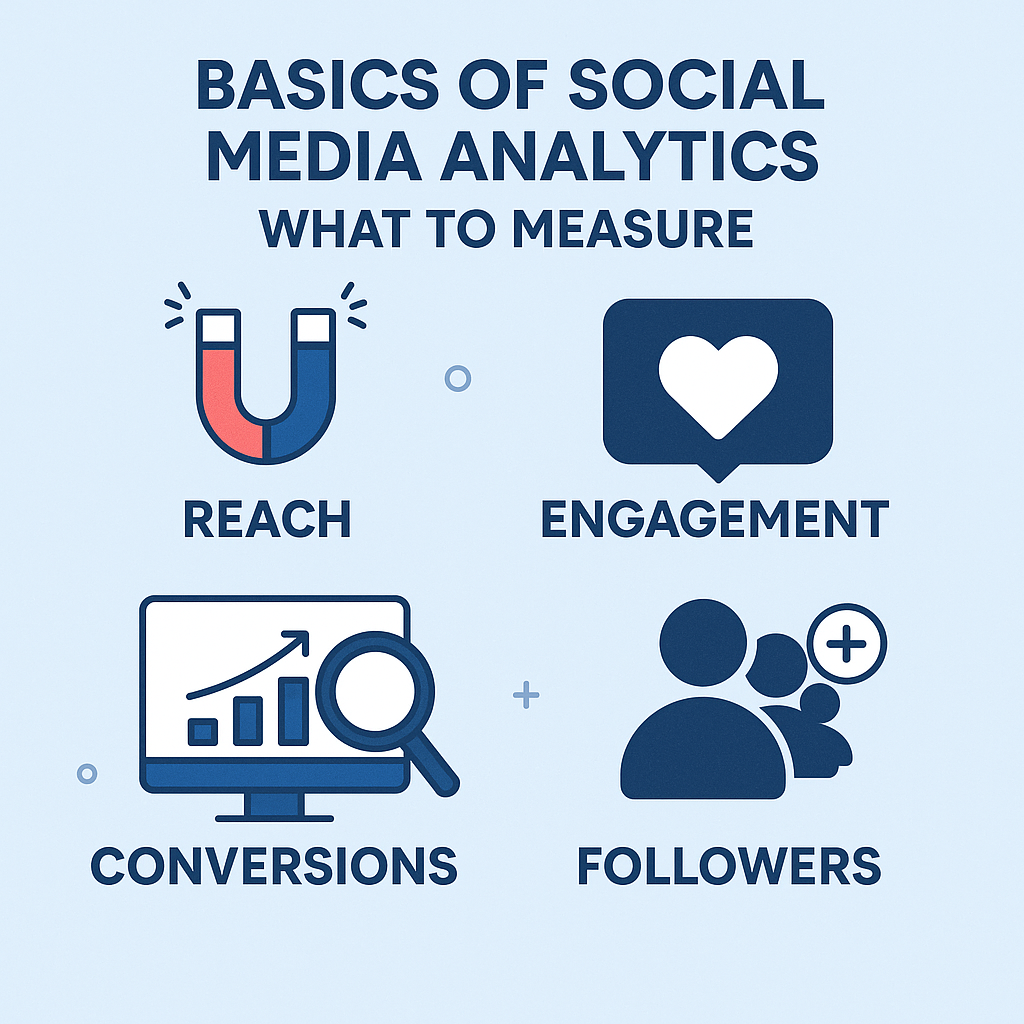
Basics of Social Media Analytics: What to Measure
Table of Contents
-
Introduction
-
What Is Social Media Analytics?
-
Why Social Media Analytics Matters
-
Key Metrics to Measure
-
Engagement Metrics
-
Reach & Impressions
-
Audience Metrics
-
Referral Traffic
-
Conversion Metrics
-
Platform-Specific Metrics
-
-
How to Choose the Right Metrics
-
Tools for Social Media Analytics
-
Setting KPIs and Benchmarks
-
Common Mistakes to Avoid
-
Reporting Tips
-
Final Thoughts
1. Introduction
Social media analytics helps brands understand how their content performs, what their audience values, and how to improve their strategy. Whether you’re a marketer, business owner, or content creator, tracking the right metrics is essential for success.
2. What Is Social Media Analytics?
Social media analytics involves gathering, measuring, and analyzing data from social media platforms to assess performance, understand audience behavior, and drive informed decisions.
It can answer questions like:
-
Which posts are driving the most engagement?
-
What type of content resonates best?
-
Are we achieving our business goals via social media?
3. Why Social Media Analytics Matters
✅ Informed Strategy – Know what’s working and what’s not.
✅ Improved ROI – Align content with what delivers the most value.
✅ Better Audience Insights – Understand demographics, preferences, and behaviors.
✅ Crisis Management – Monitor sentiment and quickly respond to issues.
✅ Competitor Benchmarking – See where you stand in your niche.
4. Key Metrics to Measure
Let’s break down the core categories of social media analytics.
📊 A. Engagement Metrics
These show how actively people are interacting with your content.
-
Likes/Reactions: Indicates content approval.
-
Comments: Signals discussion or emotional response.
-
Shares/Retweets: Amplifies reach—signals valuable content.
-
Saves: Shows long-term interest or intent to revisit.
-
Clicks: Measures content attractiveness (especially links and CTAs).
Why it matters: Engagement is often a proxy for content relevance and quality.
🌍 B. Reach & Impressions
-
Reach: The total number of unique users who saw your content.
-
Impressions: The total number of times your content was displayed (can include repeats).
Why it matters: Helps understand your content’s visibility and audience exposure.
👥 C. Audience Metrics
-
Follower Growth: Net increase or decrease in followers over time.
-
Demographics: Age, gender, location, and interests.
-
Active Times: When your audience is most active.
Why it matters: Helps tailor content and posting times for maximum impact.
🌐 D. Referral Traffic (Website Analytics)
-
Social Referral Traffic: Visitors arriving at your website from social media.
-
Bounce Rate: How many leave without interacting.
-
Pages per Session / Time on Site: Measures quality of traffic.
-
Conversion Rate: Percentage who complete a goal (signup, purchase, etc.).
Why it matters: Links social media performance to business goals.
💸 E. Conversion Metrics
-
Leads Generated
-
Form Fills or Downloads
-
Purchases from Social Campaigns
-
Cost per Conversion (for paid ads)
Why it matters: Ties social efforts directly to ROI and revenue goals.
📱 F. Platform-Specific Metrics
Each social platform offers unique data points. Here are a few examples:
| Platform | Unique Metric |
|---|---|
| Saves, Story Views, Reel Plays | |
| Post Reach, Page Likes, Actions | |
| Twitter/X | Tweet Engagements, Retweets |
| Profile Visits, Post Clicks | |
| TikTok | Average Watch Time, Follower Growth |
| YouTube | Watch Time, CTR, Subscriptions |
5. How to Choose the Right Metrics
Not all metrics are equally important. Focus on metrics that align with your goals.
| Goal | Primary Metrics |
|---|---|
| Brand Awareness | Reach, Impressions, Follower Growth |
| Engagement | Likes, Comments, Shares |
| Website Traffic | Clicks, Referral Traffic, Bounce Rate |
| Lead Generation | Signups, Downloads, Form Completions |
| Sales | Conversions, ROI, Revenue |
| Community Building | Comments, Mentions, DMs, Tags |
6. Tools for Social Media Analytics
You can use a mix of native tools and third-party platforms:
🔧 Native Platform Tools
-
Facebook Insights
-
Instagram Insights
-
Twitter/X Analytics
-
LinkedIn Analytics
-
TikTok Analytics
-
YouTube Studio
📈 Third-Party Tools
-
Google Analytics (for referral tracking)
-
Sprout Social
-
Hootsuite
-
Buffer
-
HubSpot
-
Socialbakers
-
Brandwatch
These tools help consolidate data, analyze trends, and generate reports.
7. Setting KPIs and Benchmarks
What Are KPIs?
Key Performance Indicators are the specific targets you want to achieve.
Example KPIs:
-
Increase Instagram engagement rate to 3% in 3 months.
-
Drive 500 website visits/month from Facebook.
-
Get 200 webinar signups via LinkedIn ads.
How to Set Benchmarks:
-
Use historical data from your own channels.
-
Research industry standards (e.g., average engagement rates).
-
Spy on competitors to gauge what’s realistic.
8. Common Mistakes to Avoid
🚫 Focusing on Vanity Metrics Only: Likes are nice but don’t always drive ROI.
🚫 Not Setting Goals: Measuring without direction is wasted effort.
🚫 Ignoring Negative Feedback: Critical comments = opportunities to improve.
🚫 Measuring Too Much: Focus on what matters most to your objectives.
🚫 Not Comparing Over Time: One-off snapshots don’t show trends.
9. Reporting Tips
✔️ Use visuals (charts/graphs) for clarity.
✔️ Compare performance month-over-month or quarter-over-quarter.
✔️ Highlight wins and areas for improvement.
✔️ Keep it goal-oriented—tie metrics back to business outcomes.
✔️ Use segmentation (by platform, campaign, audience type).
10. Final Thoughts
Social media analytics isn’t just about collecting data—it’s about using insights to make smarter decisions, create better content, and grow your brand. By focusing on the right metrics, you’ll stop guessing and start acting with purpose.
Whether you’re managing a startup’s Instagram or overseeing a global brand’s full social presence, measuring what matters is the key to real impact.
Author


