A Deep, Strategic Guide for Modern Digital Marketers
Performance marketing is not about impressions. It’s about outcomes.
Unlike traditional branding campaigns that optimize for reach or awareness, performance marketing is built on measurable, attributable, revenue-linked results. Every rupee, dollar, or euro spent must justify itself.
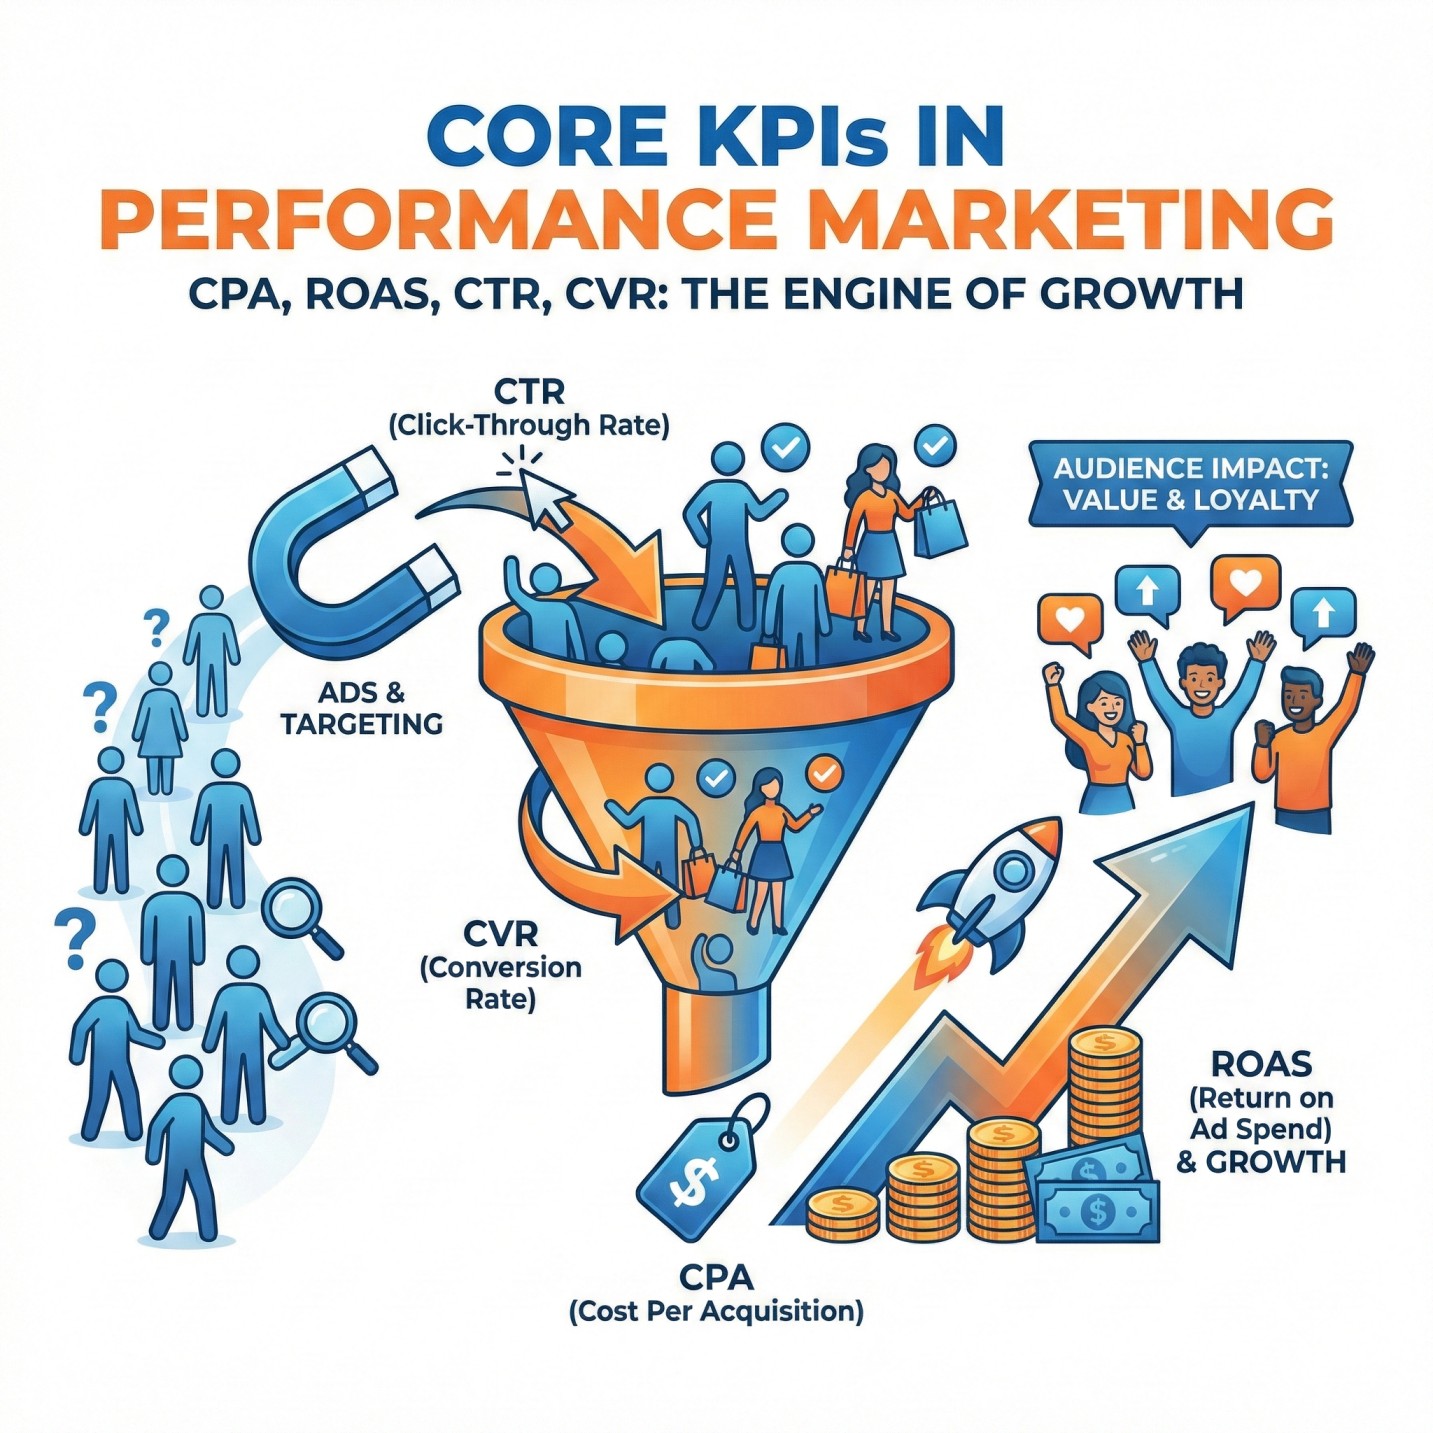
At the center of this accountability are four foundational KPIs:
CPA (Cost Per Acquisition)
ROAS (Return on Ad Spend)
CTR (Click-Through Rate)
CVR (Conversion Rate)
These metrics are not just numbers on dashboards in platforms like Google Ads, Meta Ads Manager, or LinkedIn Ads. They are signals — telling you what’s working, what’s leaking, and where growth is hiding.
This article will break down each KPI in extreme depth — formulas, psychology, optimization levers, strategic applications, advanced analysis, and real-world scenarios.
1. Cost Per Acquisition (CPA)
What is CPA?
Cost Per Acquisition (CPA) measures how much you spend to acquire one paying customer or one defined conversion.
Formula:
CPA = Total Ad Spend ÷ Total Conversions
If you spend ₹100,000 and generate 250 sales:
CPA = ₹100,000 ÷ 250 = ₹400 per acquisition
Why CPA Is the Foundation of Profitability
CPA answers one core business question:
“How much does it cost to acquire one customer?”
If your:
CPA < Customer Lifetime Value (CLTV) → You have a scalable business.
CPA > CLTV → You are losing money.
This makes CPA the primary efficiency metric in performance marketing.
Types of CPA
1. Target CPA
Used in automated bidding strategies where platforms aim to hit a specific acquisition cost.
2. Actual CPA
The real result after campaign execution.
3. Blended CPA
Total marketing spend ÷ total conversions across channels (including organic + paid).
Blended CPA gives a more realistic view of total acquisition economics.
What Influences CPA?
CPA is not an isolated metric. It is downstream of two major variables:
CTR (traffic efficiency)
CVR (conversion efficiency)
Higher CTR → More traffic
Higher CVR → More conversions
Both reduce CPA.
Strategic CPA Optimization Levers
1. Improve Targeting
Remove non-converting audiences
Narrow high-intent segments
Use first-party data
Deploy lookalikes
2. Creative Optimization
Strong hook in first 3 seconds
Problem–solution framing
Social proof
Clear CTA
3. Funnel Alignment
Message match between ad and landing page
Page load speed
Mobile optimization
Trust signals
4. Offer Engineering
Sometimes CPA is high not because ads are bad, but because the offer is weak.
Better:
Bonuses
Guarantees
Limited-time urgency
Bundles
Advanced CPA Concepts
Marginal CPA
Cost of acquiring the next customer as you scale budget.
CPA often rises at scale due to:
Audience saturation
Increased competition
Creative fatigue
Payback Period Analysis
If CPA is ₹2,000 but customer pays ₹500/month subscription:
You recover cost in 4 months.
Cash flow matters.
2. Return on Ad Spend (ROAS)
What is ROAS?
ROAS measures revenue generated for every unit of ad spend.
Formula:
ROAS = Revenue ÷ Ad Spend
If you spend ₹100,000 and generate ₹400,000 revenue:
ROAS = 4X
ROAS vs ROI
ROAS measures gross revenue return.
ROI considers profit after costs.
ROAS is channel-level efficiency.
ROI is business-level profitability.
Why ROAS Is Critical in E-commerce
For brands running on platforms like Shopify or Amazon, ROAS determines:
Budget allocation
Scaling decisions
Creative testing thresholds
Inventory planning
Break-Even ROAS Formula
Break-even ROAS = 1 ÷ Gross Margin
If margin = 25%
Break-even ROAS = 4X
Below 4X = losing money
Above 4X = profitable
Factors That Influence ROAS
AOV (Average Order Value)
Conversion Rate
Upsells & cross-sells
Audience quality
Creative performance
Pricing strategy
Advanced ROAS Thinking
1. Blended ROAS
Accounts for all channels combined.
2. Incremental ROAS
Measures incremental revenue (true lift).
3. Cohort-Based ROAS
Measures revenue over 30, 60, 90 days.
Especially important for subscription businesses.
The Scaling Paradox
As you scale:
CPA increases
ROAS declines
Because:
You exhaust warm audiences
You enter colder traffic segments
The key is finding:
Maximum profitable scale, not maximum ROAS.
3. Click-Through Rate (CTR)
What is CTR?
CTR measures the percentage of users who click after seeing your ad.
Formula:
CTR = (Clicks ÷ Impressions) × 100
If 1,000 impressions generate 50 clicks:
CTR = 5%
Why CTR Matters
CTR reflects:
Ad relevance
Creative strength
Hook quality
Targeting accuracy
Platforms like Google Ads reward high CTR with:
Better Quality Score
Lower CPC
Higher ad placements
Types of CTR
Link CTR
Unique CTR
All CTR
Outbound CTR
Each platform calculates slightly differently.
What Is a Good CTR?
It depends on:
Platform
Industry
Campaign type
General benchmarks:
Search: 3–10%
Social: 0.8–3%
Display: 0.5–1%
But context matters more than benchmarks.
How to Improve CTR
1. Creative First
Strong headline
Pattern interruption
Emotional triggers
Curiosity gap
2. Copy Frameworks
PAS (Problem–Agitate–Solution)
AIDA
Before–After–Bridge
3. Visual Hooks
Bold contrast
Human faces
Clear benefit statements
Advanced CTR Insights
High CTR but low CVR means:
Clickbait creative
Poor landing page
Audience mismatch
Low CTR but high CVR means:
Niche targeting
Strong intent
Under-scaled opportunity
CTR must always be analyzed with CVR.
4. Conversion Rate (CVR)
What is CVR?
CVR measures the percentage of clicks that convert.
Formula:
CVR = (Conversions ÷ Clicks) × 100
If 200 clicks generate 20 sales:
CVR = 10%
Why CVR Is the Hidden Growth Lever
Most marketers obsess over traffic.
But improving CVR from:
2% → 3%
Is a 50% revenue increase without increasing ad spend.
CVR is where CRO (Conversion Rate Optimization) becomes powerful.
What Impacts CVR?
1. Landing Page Experience
Speed
UX
Above-the-fold clarity
Mobile responsiveness
2. Offer Strength
Clear value proposition
Pricing psychology
Guarantees
3. Trust Signals
Reviews
Testimonials
Case studies
Security badges
4. Checkout Optimization
Fewer steps
Autofill
Multiple payment methods
CVR Optimization Framework
Step 1: Identify Bottleneck
High bounce rate?
Drop-off at checkout?
Form abandonment?
Step 2: Hypothesis Testing
Change headline
Improve CTA
Reduce friction
Step 3: A/B Testing
Use statistically significant testing before scaling.
How These KPIs Work Together
Let’s break it down mathematically:
Revenue =
Impressions × CTR × CVR × AOV
CPA =
Spend ÷ (Clicks × CVR)
ROAS =
Revenue ÷ Spend
Everything connects.
Improve CTR → More clicks
Improve CVR → More conversions
Improve AOV → Higher ROAS
Lower CPA → Higher profitability
Performance marketing is a system.
Funnel-Level KPI Analysis
| Funnel Stage | KPI Focus |
|---|---|
| Awareness | CTR |
| Consideration | CTR + CVR |
| Conversion | CVR + CPA |
| Revenue | ROAS |
Understanding which KPI to prioritize depends on campaign objective.
Common Mistakes Marketers Make
Optimizing for CTR only
Ignoring blended CPA
Chasing high ROAS without scaling
Not calculating break-even ROAS
Ignoring LTV in CPA decisions
Scaling before funnel optimization
Not analyzing cohort performance
Advanced Performance Marketing Dashboard Setup
To manage these KPIs effectively:
Track:
Channel-level CPA
Campaign-level ROAS
Creative-level CTR
Landing-page CVR
Blended metrics
7-day, 30-day, 90-day windows
Use:
Attribution modeling
Cohort tracking
Incrementality testing
Real-World Scenario Example
Imagine an e-commerce brand:
Spend: ₹500,000
CTR: 2%
CVR: 2%
AOV: ₹2,000
If you improve:
CTR → 3%
CVR → 3%
Revenue increases dramatically without increasing budget.
That’s the compound effect of KPI optimization.
The Strategic Hierarchy of KPIs
CVR (Hardest but most powerful lever)
CPA (Controls profitability)
ROAS (Controls scalability)
CTR (Controls traffic cost)
Elite performance marketers understand:
Traffic is rented. Conversion is owned.
Final Thoughts
CPA, ROAS, CTR, and CVR are not isolated metrics.
They are interdependent levers in a performance ecosystem.
Mastering them requires:
Analytical depth
Creative excellence
Testing discipline
Business understanding
Financial modeling
If you want to scale performance marketing campaigns sustainably, you must:
Know your break-even metrics
Understand your funnel math
Optimize holistically
Think beyond platform dashboards
Align KPIs with business profitability
Performance marketing is not about getting more clicks.
It’s about building a predictable revenue engine.
And these four KPIs are the engine’s core.
Author