A Step-by-Step Guide to Boost Conversions
Table of Contents:
-
Introduction to CRO Roadmapping
-
Understanding the Foundations of CRO
-
Step 1: Define Clear Business Goals and KPIs
-
Step 2: Conduct Heuristic Analysis
-
Step 3: Collect Quantitative and Qualitative Data
-
Step 4: Segment and Prioritize Insights
-
Step 5: Formulate Hypotheses
-
Step 6: Design and Prototype CRO Tests
-
Step 7: Implement A/B, Multivariate, or Split Tests
-
Step 8: Analyze, Interpret, and Apply Learnings
-
Step 9: Build a Feedback Loop and Maintain Momentum
-
Tools and Technologies for CRO Success
-
CRO Roadmap Template (Downloadable Example)
-
Common Pitfalls and How to Avoid Them
-
Conclusion
1. Introduction to CRO Roadmapping
Conversion Rate Optimization (CRO) is more than tweaking buttons and headlines. It’s a structured, data-informed process focused on maximizing the value of each visitor by improving the rate at which they take desired actions. Creating a CRO roadmap helps align teams, organize priorities, and drive consistent growth through a strategic testing plan.
2. Understanding the Foundations of CRO
Before you build a roadmap, understand what CRO truly entails:
-
Conversion Rate = (Conversions / Total Visitors) × 100
-
CRO is not just about increasing conversion rate; it’s about optimizing the customer experience to improve lifetime value, customer retention, and user satisfaction.
Key elements:
3. Step 1: Define Clear Business Goals and KPIs
Why it matters: If you don’t know where you’re going, any test will seem worthwhile. Start with clarity.
KPIs to Track:
4. Step 2: Conduct Heuristic Analysis
A heuristic evaluation helps uncover obvious usability issues and friction points.
Heuristic frameworks:
-
LIFT Model: Value Proposition, Relevance, Clarity, Urgency, Anxiety, Distraction
-
Jakob Nielsen’s Heuristics: Consistency, Visibility, Error Prevention, etc.
Evaluate:
Create a list of “low-hanging fruit” and UX friction points.
5. Step 3: Collect Quantitative and Qualitative Data
To make informed decisions, gather insights from both behavioral data and user feedback.
Quantitative Sources:
-
Google Analytics: Drop-off points, funnels, bounce rate, traffic segments
-
Heatmaps/Clickmaps: Hotjar, Crazy Egg, Microsoft Clarity
-
Session Recordings
Qualitative Sources:
-
On-site surveys (e.g., “What’s stopping you from buying today?”)
-
Customer interviews
-
User testing (remote or moderated)
-
Support and live chat transcripts
6. Step 4: Segment and Prioritize Insights
Not all insights are equal. Use frameworks to prioritize what to test first.
Frameworks:
-
PIE Framework (Potential, Importance, Ease)
-
ICE Score (Impact, Confidence, Ease)
-
TIR (Time, Impact, Resources)
Prioritize:
-
High-traffic pages (home, category, product, checkout)
-
High-exit or high-bounce pages
-
Pages with significant revenue or lead generation potential
7. Step 5: Formulate Hypotheses
Each test should begin with a clear, measurable hypothesis.
Structure:
If we [change X], it will [impact Y], because [reason based on data].
Example:
If we simplify the checkout form from 5 fields to 3, the completion rate will increase because user testing revealed form fatigue and confusion.
Avoid vague or “best practice” assumptions—tie each hypothesis to user behavior.
8. Step 6: Design and Prototype CRO Tests
Now bring hypotheses to life through UX/UI changes, copy, and interactions.
Design Considerations:
-
Wireframes (low-fidelity) or mockups (high-fidelity)
-
Mobile-first and responsive designs
-
Accessibility (ADA/WCAG compliance)
What to Test:
-
Headlines, CTAs
-
Product imagery
-
Value propositions
-
Page layouts and navigation
-
Trust signals (testimonials, security badges, guarantees)
Collaborate with designers, developers, and copywriters.
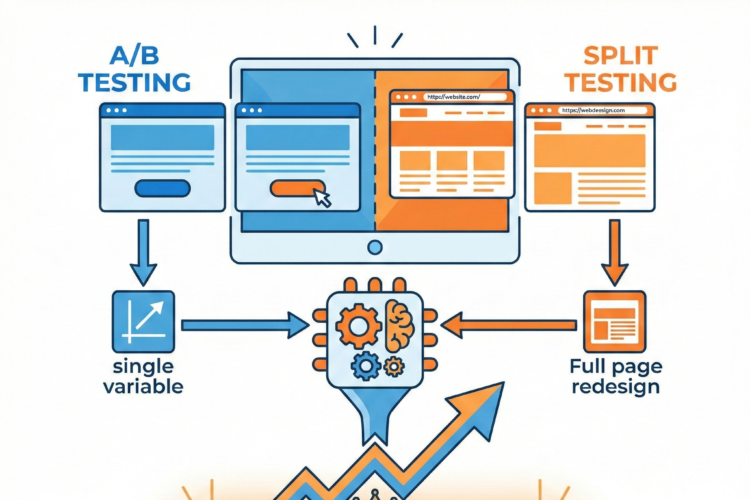
9. Step 7: Implement A/B, Multivariate, or Split Tests
Pick the right testing methodology:
| Test Type |
Use Case |
| A/B Test |
One element change (e.g., CTA color or wording) |
| Multivariate Test |
Multiple elements simultaneously (e.g., header + image) |
| Split URL Test |
Testing entirely different page layouts |
Best Practices:
-
Minimum sample size for statistical significance
-
Avoid testing during seasonal events unless planned
-
Maintain consistent traffic sources during testing
-
Run tests for 2–4 weeks or until statistically valid
10. Step 8: Analyze, Interpret, and Apply Learnings
Once the test concludes, it’s time to interpret the data.
Key Metrics:
-
Uplift in conversion rate
-
Confidence level (typically 90–95%)
-
Bounce rate, time on page, cart abandonment
Scenario Handling:
-
Win: Deploy variation and analyze impact over time.
-
Loss: Learn why the hypothesis failed—was the assumption flawed?
-
Neutral: May need to test further or segment by audience.
Document results meticulously.
11. Step 9: Build a Feedback Loop and Maintain Momentum
CRO is ongoing—not a one-time project.
How to scale:
-
Maintain a test log/knowledge base
-
Review metrics monthly
-
Introduce monthly CRO sprints
-
Train team on interpreting CRO data
-
Celebrate wins and share learnings across departments
Keep testing. The moment you stop is the moment your competitors pull ahead.
12. Tools and Technologies for CRO Success
Analytics & Heatmaps:
Testing Platforms:
Survey Tools:
User Testing:
Collaboration & Documentation:
13. CRO Roadmap Template (Downloadable Example)
Here’s a simple roadmap outline you can use:
| Step |
Action |
Owner |
Priority |
Status |
Notes |
| 1 |
Heuristic Audit |
UX Lead |
High |
Done |
Based on LIFT model |
| 2 |
Install Heatmaps |
Dev |
Medium |
In Progress |
Crazy Egg |
| 3 |
Run Exit Survey |
CRO Manager |
Medium |
Not Started |
Ask “What stopped you?” |
| 4 |
A/B Test Checkout CTA |
Dev |
High |
Not Started |
Hypothesis formed |
(Create this in Notion, Excel, or any PM tool.)
14. Common Pitfalls and How to Avoid Them
| Pitfall |
Fix |
| Testing without data |
Always root tests in user behavior |
| Declaring results too early |
Wait for statistical significance |
| Focusing only on macro-conversions |
Track micro-conversions too |
| Lack of documentation |
Keep a test log |
| “Set and forget” mindset |
Build a repeatable process |
15. Conclusion
A CRO roadmap gives your optimization efforts purpose, clarity, and structure. By following a data-driven approach, aligning stakeholders, and continuously testing and iterating, you’ll improve not just conversion rates—but the overall customer experience.
Whether you’re optimizing a B2B SaaS funnel, an e-commerce store, or a lead gen website, having a CRO roadmap turns guesswork into growth.