

How Core Web Vitals Affect Your SEO Performance
Introduction: The Evolution of Page Experience in SEO
For years, SEO professionals focused primarily on content quality, keywords, and backlinks to achieve high search rankings. While these elements remain crucial, Google has progressively emphasized user experience as a critical ranking factor. Core Web Vitals represent Google’s most concrete and measurable approach to evaluating page experience, fundamentally changing how we must approach technical SEO.
Introduced in 2020 and integrated into Google’s ranking algorithm in June 2021, Core Web Vitals are a set of specific metrics that Google considers essential for delivering excellent user experience. They measure real-world user experience in terms of loading performance, interactivity, and visual stability. For the first time, Google provided clear, quantifiable standards for what constitutes a “fast” and “smooth” website experience.
This comprehensive guide explains what Core Web Vitals are, why they matter for your SEO performance, how to measure them, and most importantly, how to optimize them to improve your search rankings and user experience simultaneously.
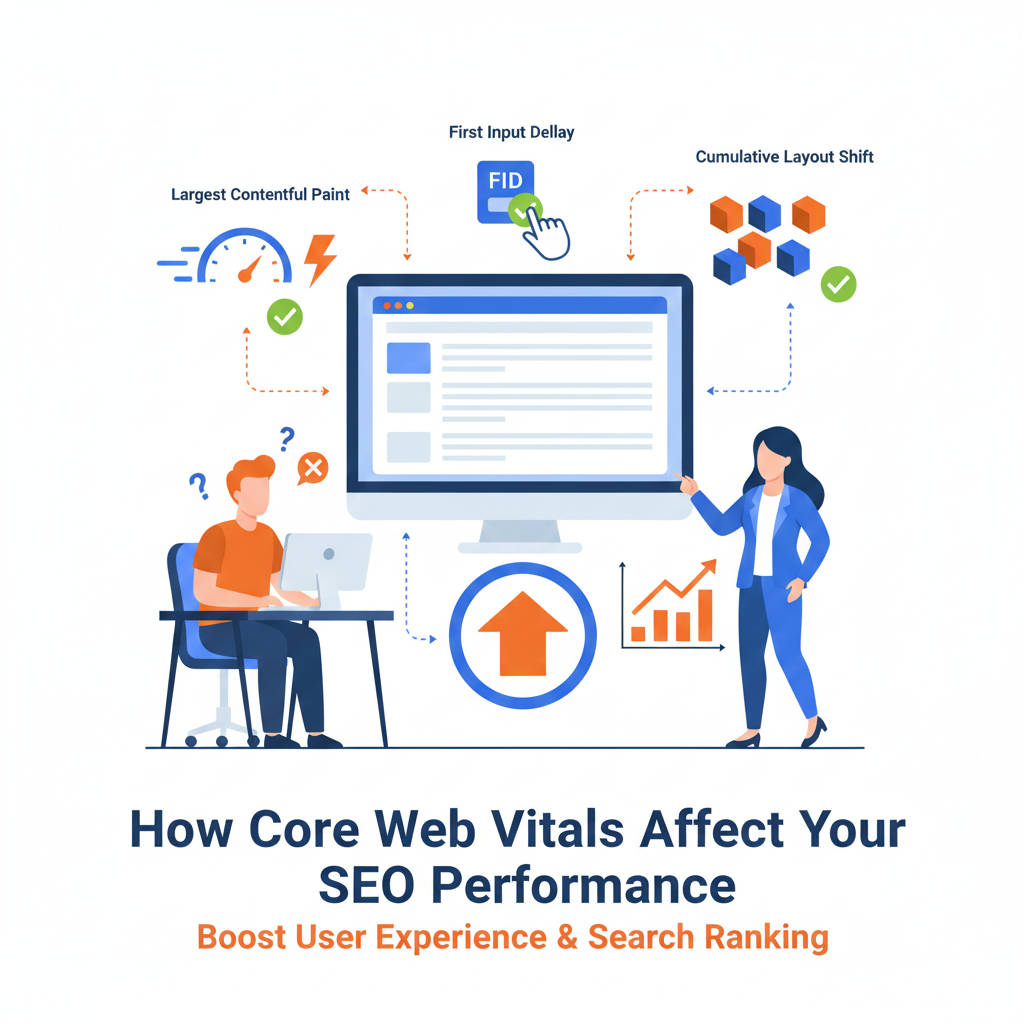
Understanding Core Web Vitals: The Three Pillars
Core Web Vitals consist of three specific metrics, each representing a distinct facet of user experience:
1. Largest Contentful Paint (LCP)
What It Measures: Loading performance—specifically, how long it takes for the largest visible content element to appear on screen.
Why It Matters: LCP measures the perceived loading speed from a user’s perspective. It’s not about when your entire page loads, but when users can see the main content they came for.
The Largest Content Element typically includes:
- Hero images or banners
- Large text blocks or headlines
- Video thumbnails
- Background images with text overlay
- Image carousels or sliders
Performance Thresholds:
- Good: 2.5 seconds or less
- Needs Improvement: 2.5-4.0 seconds
- Poor: More than 4.0 seconds
User Experience Impact: When LCP is slow, users face a frustrating blank or partially loaded screen. They may think the page isn’t working, leading to abandonment. Studies show that as page load time increases from 1 to 3 seconds, bounce rate probability increases by 32%. From 1 to 5 seconds, it increases by 90%.
Common LCP Elements by Page Type:
- E-commerce: Product images
- Blogs: Featured images or first paragraph
- Landing pages: Hero sections with headlines and images
- Homepages: Banner images or video headers
2. First Input Delay (FID) / Interaction to Next Paint (INP)
What It Measures: Interactivity and responsiveness—the time between when a user first interacts with your page and when the browser can respond to that interaction.
Important Update: As of March 2024, Google replaced FID with INP (Interaction to Next Paint) as the official Core Web Vital. INP provides a more comprehensive measure of overall responsiveness throughout the page lifecycle, not just first interaction.
INP Performance Thresholds:
- Good: 200 milliseconds or less
- Needs Improvement: 200-500 milliseconds
- Poor: More than 500 milliseconds
Types of Interactions Measured:
- Clicking buttons or links
- Tapping on mobile elements
- Pressing keys in form fields
- Opening menus or dropdowns
- Interacting with custom controls
User Experience Impact: Poor interactivity creates the frustrating experience of clicking something and nothing happening—or worse, clicking again and triggering double actions. Users perceive unresponsive pages as broken or low-quality, directly impacting trust and conversions.
Why Google Made the Change: FID only measured the first interaction, which meant pages could score well on FID while being unresponsive throughout the rest of the user’s visit. INP provides a holistic view of responsiveness across all interactions during the entire page lifecycle.
3. Cumulative Layout Shift (CLS)
What It Measures: Visual stability—how much unexpected layout shifting occurs as the page loads.
Why It Matters: Have you ever started reading an article when suddenly an ad loads and pushes everything down, causing you to lose your place? Or clicked a button just as something shifted and you accidentally clicked an ad instead? That’s layout shift, and it’s incredibly frustrating.
Performance Thresholds:
- Good: 0.1 or less
- Needs Improvement: 0.1-0.25
- Poor: More than 0.25
Common Causes of Layout Shift:
- Images without defined dimensions loading and pushing content down
- Ads, embeds, or iframes without reserved space
- Web fonts loading and causing text reflow (FOIT/FOUT)
- Dynamically injected content pushing existing content
- Animations or transitions that affect layout
- CSS that causes content to resize after initial render
User Experience Impact: Layout shifts cause misclicks, lost reading position, and general frustration. They make pages feel unstable and unprofessional. For e-commerce sites, layout shifts at checkout can directly cause abandoned carts.
How CLS Is Calculated: CLS measures the impact fraction (portion of viewport affected) multiplied by the distance fraction (how far elements moved). Unlike the other metrics measured in time, CLS is unitless, representing the sum of all individual layout shift scores.
Why Core Web Vitals Matter for SEO
Direct Ranking Impact
Google explicitly confirmed that Core Web Vitals are ranking factors as part of the “page experience” signal. While they’re not the most heavily weighted ranking factors (content relevance and quality still dominate), they serve as tiebreakers between similarly relevant pages and can significantly impact rankings in competitive niches.
The Compounding Effect: In competitive search queries where multiple pages offer similar content quality, Core Web Vitals can be the differentiator that determines which pages appear on page one versus page two—a difference that dramatically affects traffic.
Mobile-First Indexing: Google predominantly uses the mobile version of pages for indexing and ranking. Since Core Web Vitals are particularly important for mobile users (slower connections, less powerful devices), optimizing for these metrics is essential for mobile SEO performance.
Indirect SEO Benefits
Beyond direct ranking influence, Core Web Vitals impact numerous user behavior metrics that indirectly affect SEO:
Reduced Bounce Rate: Fast-loading, stable pages keep users engaged longer. Lower bounce rates signal to Google that your page satisfies user intent.
Increased Dwell Time: When pages load quickly and respond smoothly, users spend more time engaging with content, sending positive engagement signals to search engines.
Higher Click-Through Rates: While Core Web Vitals don’t directly affect CTR from search results, better user experiences from previous visits create positive brand associations, increasing likelihood of clicks on your results in future searches.
Improved Crawl Efficiency: Fast, technically sound websites allow search engine crawlers to index more pages in less time, potentially improving crawl frequency and depth.
Enhanced Link Acquisition: Exceptional user experiences increase the likelihood of earning backlinks, social shares, and referrals—all of which strengthen your broader SEO profile.
User Experience and Business Metrics
Core Web Vitals optimization delivers measurable business value beyond rankings:
Conversion Rate Impact: Multiple studies demonstrate direct correlation between Core Web Vitals performance and conversions:
- Vodafone improved LCP by 31% and saw 8% more sales
- COOK improved CLS by 0.25 and increased conversions by 7%
- Rakuten 24 improved LCP by 1.2 seconds and revenue per visitor increased by 53.37%
Mobile Revenue: With mobile commerce growing rapidly, mobile performance directly impacts bottom line. A one-second delay in mobile load time can reduce conversions by up to 20%.
Customer Satisfaction: Better page experience correlates with higher satisfaction scores, increased customer lifetime value, and improved brand perception.
Competitive Advantage
In many industries, Core Web Vitals optimization remains relatively uncommon. Many websites, including those of major brands, still fail Core Web Vitals assessments. This presents a significant opportunity: by prioritizing these metrics, you can gain competitive advantage even against larger, more established competitors with higher domain authority.
How to Measure Core Web Vitals
Google’s Official Tools
Google Search Console
Search Console’s Core Web Vitals report provides the most actionable SEO-focused data:
What It Shows:
- Which URLs pass or fail Core Web Vitals assessment
- Grouping of similar pages by issues
- Mobile and desktop data separately
- Historical trends over time
How to Access:
- Open Google Search Console
- Navigate to “Experience” → “Core Web Vitals”
- Review “Poor,” “Needs Improvement,” and “Good” URLs
Advantages:
- Real user data (field data) from Chrome users
- Shows how Google actually assesses your pages
- Identifies which URLs need attention
- Integrates with other Search Console data
Limitations:
- Requires sufficient traffic (minimum 28 days of data)
- Updates with a lag (not real-time)
- Doesn’t provide detailed diagnostics
PageSpeed Insights
Google’s web-based tool providing both lab and field data:
What It Provides:
- Performance score (0-100)
- Individual Core Web Vitals metrics with pass/fail status
- Field data from real Chrome users (when available)
- Lab data from simulated testing
- Specific optimization recommendations
- Desktop and mobile analysis
How to Use:
- Visit pagespeed.web.dev
- Enter your URL
- Review both field data (real user experience) and lab data (controlled test)
Understanding the Data:
Field Data (Origin Summary): Real-world performance from actual Chrome users over the past 28 days. This is what Google uses for rankings.
Lab Data: Simulated test in controlled conditions. Useful for debugging but not what Google uses for ranking decisions.
Lighthouse
The open-source auditing tool that powers PageSpeed Insights:
Access Methods:
- Chrome DevTools (F12 → Lighthouse tab)
- Command line interface
- Node module for automated testing
- CI/CD integration for continuous monitoring
Advantages:
- Detailed performance analysis
- Privacy and security audits
- Accessibility checks
- SEO recommendations
- Custom throttling and device emulation
- Can test pages behind authentication
When to Use Lighthouse:
- Development and testing environments
- Diagnosing specific performance issues
- Before deployment (CI/CD integration)
- Pages not yet in production
Chrome User Experience Report (CrUX)
Google’s dataset of real user experience metrics from Chrome users:
Access Options:
- CrUX Dashboard (Data Studio visualization)
- CrUX API
- BigQuery (for advanced analysis)
- PageSpeed Insights (displays CrUX data)
What It Offers:
- Aggregate data for entire origins (domains)
- Country-level and global data
- Connection type breakdowns
- Device category splits
- Monthly historical data
Use Cases:
- Competitor benchmarking
- Industry comparisons
- Tracking long-term trends
- Market research
Third-Party Tools
WebPageTest
Advanced testing tool offering deep performance insights:
Features:
- Multiple testing locations globally
- Custom connection speeds
- Video capture of loading
- Waterfall charts showing every request
- Comparison of multiple URLs
- Extensive metrics beyond Core Web Vitals
GTmetrix
User-friendly performance testing with historical tracking:
Capabilities:
- Performance scoring
- Structure and waterfall visualization
- Historical monitoring
- Alerts for performance regression
- Video playback of loading
Real User Monitoring (RUM) Tools
For ongoing production monitoring:
Popular Options:
- Google Analytics 4 (with web vitals integration)
- Cloudflare Web Analytics
- New Relic
- Datadog
- Sentry
Advantages:
- Continuous real user data
- Segmentation by user characteristics
- Alerting for performance degradation
- Integration with analytics platforms
Optimizing Largest Contentful Paint (LCP)
LCP is typically the most challenging Core Web Vital to optimize. Here’s how to improve it:
Identify Your LCP Element
Before optimization, determine what element constitutes your LCP:
Using Chrome DevTools:
- Open page in Chrome
- Press F12 to open DevTools
- Open Performance tab
- Click record, refresh page, stop recording
- Look for “LCP” marker in timeline
- Click to see which element
Using Web Vitals Extension: Install Google’s Web Vitals Chrome extension for quick identification of LCP elements.
Optimize Server Response Time (TTFB)
Time to First Byte directly impacts when your page can begin rendering the LCP element.
Target: Under 600ms (ideally under 200ms)
Optimization Strategies:
Use Fast, Quality Hosting: Shared hosting on overloaded servers creates slow TTFB. Consider:
- Managed WordPress hosting (WP Engine, Kinsta, Flywheel)
- High-performance VPS or dedicated servers
- Cloud hosting with autoscaling (AWS, Google Cloud, Azure)
Implement Caching: Serve pre-generated HTML instead of dynamically generating every page:
- Full-page caching plugins (WP Rocket, W3 Total Cache, WP Super Cache)
- Server-level caching (Varnish, Redis)
- CDN edge caching
Optimize Database Queries: Slow database operations delay page generation:
- Index frequently queried columns
- Optimize complex queries
- Clean up post revisions and spam comments
- Use query caching
- Consider managed database services
Upgrade PHP Version: Newer PHP versions are significantly faster. PHP 8+ offers substantial performance improvements over PHP 7.
Choose Nearby Server Locations: Host servers geographically close to your primary audience, or use CDN to serve from edge locations.
Optimize and Compress Images
Images are the most common LCP element, making image optimization crucial:
Choose Appropriate Formats:
WebP: Modern format offering 25-35% smaller file sizes than JPEG/PNG with similar quality. Supported by all modern browsers.
AVIF: Even newer format with better compression than WebP, but browser support is still growing.
JPEG: Use for photographs when WebP isn’t available. Optimize at 80-85% quality for good balance.
PNG: For images requiring transparency, but compress aggressively.
Compress Aggressively:
- Use tools like TinyPNG, Squoosh, or ImageOptim
- WordPress plugins: ShortPixel, Imagify, Smush
- Build tools: imagemin for automated optimization
- Aim for 80-85% quality—often visually indistinguishable from 100%
Implement Responsive Images:
Use srcset to serve appropriately sized images for different screens:
<img src="image-800.jpg"
     srcset="image-400.jpg 400w,
             image-800.jpg 800w,
             image-1200.jpg 1200w"
     sizes="(max-width: 600px) 400px,
            (max-width: 1000px) 800px,
            1200px"
     alt="Description">
This ensures mobile users don’t download desktop-sized images.
Set Explicit Dimensions:
Always include width and height attributes to prevent layout shift:
<img src="image.jpg" width="800" height="600" alt="Description">
Modern browsers use these to reserve space before the image loads, improving CLS as well.
Eliminate Render-Blocking Resources
CSS and JavaScript files can block rendering of your LCP element.
Critical CSS Inline:
Extract and inline above-the-fold CSS directly in the <head>:
<style>
  /* Critical CSS for above-the-fold content */
  .hero { background: #000; padding: 2rem; }
  .headline { font-size: 2.5rem; color: white; }
</style>
Then load full stylesheet asynchronously:
<link rel="preload" href="styles.css" as="style" onload="this.onload=null;this.rel='stylesheet'">
<noscript><link rel="stylesheet" href="styles.css"></noscript>
Defer Non-Critical JavaScript:
Add defer or async attributes to script tags:
<script src="analytics.js" defer></script>
<script src="ads.js" async></script>
defer: Downloads in background, executes after HTML parsingasync: Downloads in background, executes as soon as available
Minimize CSS and JavaScript:
Remove whitespace, comments, and unnecessary code:
- Use build tools (webpack, Rollup, Parcel)
- WordPress plugins (Autoptimize, WP Rocket)
- CDNs with automatic minification (Cloudflare)
Implement Preloading
Tell the browser about critical resources before they’re discovered:
Preload LCP Images:
<link rel="preload" as="image" href="hero-image.jpg" fetchpriority="high">
Preload Critical Fonts:
<link rel="preload" as="font" type="font/woff2" href="font.woff2" crossorigin>
Use Fetchpriority:
HTML attribute indicating resource importance:
<img src="hero.jpg" fetchpriority="high" alt="Hero image">
Use a Content Delivery Network (CDN)
CDNs cache your content on servers worldwide, serving it from locations closest to users:
Popular CDN Options:
- Cloudflare (free tier available)
- Amazon CloudFront
- Fastly
- BunnyCDN
- KeyCDN
Benefits:
- Reduced latency through geographic proximity
- Reduced server load
- DDoS protection
- Automatic image optimization (some CDNs)
- HTTP/3 and modern protocol support
Optimizing Interaction to Next Paint (INP)
INP measures responsiveness throughout the page lifecycle. Optimization focuses on reducing JavaScript execution time and main thread work.
Minimize JavaScript Execution
Code Splitting:
Break JavaScript into smaller chunks loaded only when needed:
// Instead of loading everything upfront
import heavyLibrary from './heavy-library';

// Use dynamic imports
button.addEventListener('click', async () => {
  const module = await import('./heavy-library');
  module.doSomething();
});
Tree Shaking:
Remove unused code from JavaScript bundles using modern bundlers (webpack, Rollup, Parcel with proper configuration).
Remove Unused Third-Party Scripts:
Audit and eliminate unnecessary:
- Analytics tags
- Social media widgets
- Chat plugins
- Advertising scripts
- A/B testing tools
Each script adds execution overhead. Only include what provides value.
Optimize Third-Party Scripts
Load Scripts Asynchronously:
Prevent third-party code from blocking main thread:
<script src="https://example.com/widget.js" async></script>
Use Facades for Heavy Embeds:
Replace heavy embeds (YouTube, maps) with lightweight facades that load full content on interaction:
Example: YouTube Facade
Instead of full YouTube embed, show thumbnail with play button. Load actual embed only when clicked, saving megabytes of JavaScript.
Delay Non-Essential Scripts:
Load analytics, chat widgets, and other non-critical scripts after user interaction or with setTimeout:
// Delay analytics until after page interaction
window.addEventListener('load', () => {
  setTimeout(() => {
    // Load analytics here
  }, 3000);
});
Break Up Long Tasks
JavaScript tasks over 50ms are considered “long tasks” that block the main thread.
Use Web Workers:
Move heavy computations off the main thread:
// Create worker
const worker = new Worker('calculation-worker.js');

// Send data to worker
worker.postMessage(data);

// Receive results without blocking main thread
worker.onmessage = (e) => {
  console.log('Result:', e.data);
};
Implement Task Splitting:
Break long operations into smaller chunks:
// Instead of processing 1000 items at once
async function processItems(items) {
  for (let i = 0; i < items.length; i++) {
    processItem(items[i]);

    // Yield to browser every 50 items
    if (i % 50 === 0) {
      await new Promise(resolve => setTimeout(resolve, 0));
    }
  }
}
Optimize Event Handlers
Debounce and Throttle:
Limit how often expensive handlers execute:
// Debounce: Execute only after user stops acting
function debounce(func, wait) {
  let timeout;
  return function executedFunction(...args) {
    clearTimeout(timeout);
    timeout = setTimeout(() => func(...args), wait);
  };
}

// Usage
input.addEventListener('input', debounce(expensiveOperation, 300));

// Throttle: Execute at most once per time period
function throttle(func, limit) {
  let inThrottle;
  return function(...args) {
    if (!inThrottle) {
      func.apply(this, args);
      inThrottle = true;
      setTimeout(() => inThrottle = false, limit);
    }
  }
}
Use Passive Event Listeners:
Improve scroll performance:
document.addEventListener('scroll', handler, { passive: true });
This tells the browser the listener won’t call preventDefault(), allowing optimized scrolling.
Reduce DOM Size
Large DOMs slow down rendering and interaction:
Target: Under 1,500 DOM nodes (ideally under 800)
Optimization Strategies:
- Simplify page structure
- Remove unnecessary wrapper divs
- Lazy load content below the fold
- Use pagination instead of infinite scroll
- Virtualize long lists (render only visible items)
Optimizing Cumulative Layout Shift (CLS)
CLS optimization focuses on preventing unexpected layout changes.
Set Size Attributes on Media
Images:
Always include width and height:
<img src="product.jpg" width="600" height="400" alt="Product">
Modern browsers use aspect ratio calculation to reserve space.
Videos:
<video width="640" height="360" poster="thumbnail.jpg">
  <source src="video.mp4" type="video/mp4">
</video>
Iframes and Embeds:
Use aspect ratio containers:
.embed-container {
  position: relative;
  padding-bottom: 56.25%; /* 16:9 aspect ratio */
  height: 0;
  overflow: hidden;
}

.embed-container iframe {
  position: absolute;
  top: 0;
  left: 0;
  width: 100%;
  height: 100%;
}
Reserve Space for Dynamic Content
Ads:
Use minimum height containers for ad slots:
.ad-slot {
  min-height: 250px; /* Match common ad size */
  background: #f0f0f0; /* Subtle placeholder */
}
Banners and Notifications:
Avoid inserting content that pushes existing content down. Use:
- Overlays instead of inline banners
- Fixed-position elements
- Slide-down animations that don’t affect layout
Loading Skeletons:
Show placeholder content with correct dimensions while loading:
<div class="skeleton" style="width: 100%; height: 200px;"></div>
Replace with actual content once loaded without layout shift.
Optimize Font Loading
Web fonts can cause layout shift when they replace fallback fonts (FOUT – Flash of Unstyled Text) or become visible after being invisible (FOIT – Flash of Invisible Text).
Use font-display:
@font-face {
  font-family: 'Custom Font';
  src: url('font.woff2') format('woff2');
  font-display: optional; /* or swap */
}
Options:
optional: Use custom font if available immediately, otherwise use fallbackswap: Show fallback immediately, swap to custom font when loadedfallback: Brief invisible period, then swap if loaded quickly
Preload Critical Fonts:
<link rel="preload" as="font" type="font/woff2" href="font.woff2" crossorigin>
Match Fallback Font Metrics:
Use size-adjust, ascent-override, etc. to make fallback fonts match custom font dimensions:
@font-face {
  font-family: 'Fallback Font';
  src: local('Arial');
  size-adjust: 97%; /* Adjust to match custom font */
  ascent-override: 105%;
  descent-override: 35%;
}
Avoid Inserting Content Above Existing Content
Don’t Dynamically Add Elements Above Fold:
If you must add content, do so below existing content or use fixed/absolute positioning.
Handle Cookie Banners Carefully:
Use fixed positioning or slide from bottom/top without affecting layout:
.cookie-banner {
  position: fixed;
  bottom: 0;
  left: 0;
  right: 0;
  /* This doesn't shift page content */
}
Use CSS Transform for Animations
Transforms and opacity changes don’t trigger layout:
/* Good - no layout shift */
.element {
  transform: translateY(100px);
  transition: transform 0.3s;
}

/* Bad - causes layout shift */
.element {
  margin-top: 100px;
  transition: margin-top 0.3s;
}
Advanced Optimization Techniques
Resource Hints
dns-prefetch:
Resolve DNS early for third-party domains:
<link rel="dns-prefetch" href="https://analytics.google.com">
preconnect:
Establish early connections to important third-party origins:
<link rel="preconnect" href="https://fonts.googleapis.com">
<link rel="preconnect" href="https://fonts.gstatic.com" crossorigin>
prefetch:
Download resources needed for future navigation:
<link rel="prefetch" href="/next-page.html">
HTTP/2 and HTTP/3
Modern protocols offer performance benefits:
HTTP/2 Advantages:
- Multiplexing (multiple requests over single connection)
- Header compression
- Server push capabilities
HTTP/3 Advantages:
- Built on QUIC protocol
- Faster connection establishment
- Better handling of packet loss
- Improved mobile performance
Implementation:
Most modern hosting and CDN services support HTTP/2 and HTTP/3. Ensure HTTPS is enabled (required for HTTP/2) and check with your provider about HTTP/3 support.
Service Workers
Cache resources and enable offline functionality:
// Simple service worker for caching
self.addEventListener('install', (event) => {
  event.waitUntil(
    caches.open('v1').then((cache) => {
      return cache.addAll([
        '/',
        '/styles.css',
        '/script.js',
        '/logo.png'
      ]);
    })
  );
});

self.addEventListener('fetch', (event) => {
  event.respondWith(
    caches.match(event.request).then((response) => {
      return response || fetch(event.request);
    })
  );
});
Benefits:
- Instant repeat visits
- Offline functionality
- Reduced server load
- Improved perceived performance
AMP (Accelerated Mobile Pages)
Google’s framework for fast mobile pages:
Pros:
- Guaranteed fast loading
- Potential visibility boost in mobile search
- Simplified development constraints
Cons:
- Limited functionality
- Restricted JavaScript
- Additional maintenance
- Declining importance as Core Web Vitals become standard
Recommendation: Focus on optimizing regular pages for Core Web Vitals rather than maintaining separate AMP versions, unless operating in a niche where AMP provides specific advantages (news publishers, for example).
Common Pitfalls and How to Avoid Them
Optimization for Lab Data Instead of Field Data
The Problem: Achieving perfect Lighthouse scores doesn’t guarantee real users experience those speeds.
The Solution: Prioritize field data from Search Console and CrUX. Lab data is useful for diagnostics but field data determines rankings.
Over-Optimizing One Metric at the Expense of Others
The Problem: Aggressively optimizing LCP while ignoring CLS or INP creates imbalanced experiences.
The Solution: All three metrics must pass the “Good” threshold. Balance optimization efforts across all Core Web Vitals.
Ignoring Mobile Performance
The Problem: Testing only on fast desktop connections with powerful devices while most users browse on mobile.
The Solution: Always test on actual mobile devices with throttled connections. Use Chrome DevTools device emulation with network throttling.
Not Testing After Changes
The Problem: Assuming optimizations worked without verification. Sometimes “improvements” actually harm performance.
The Solution: Implement continuous monitoring. Test before and after every significant change. Use A/B testing when possible to validate improvements.
Sacrificing Functionality for Speed
The Problem: Removing features users need in pursuit of perfect scores.
The Solution: Balance performance with functionality. Sometimes a slightly slower but more functional experience is better. Focus on passing thresholds, not achieving perfect scores.
Neglecting Third-Party Scripts
The Problem: Third-party scripts (analytics, ads, chat widgets) can devastate performance but are often overlooked.
The Solution: Audit all third-party scripts regularly. Remove unnecessary ones. Lazy load or delay non-critical scripts. Use facades for heavy embeds.
Industry-Specific Considerations
E-commerce Sites
Unique Challenges:
- Large product image galleries
- Real-time inventory and pricing updates
- Third-party payment processors
- Recommendation engines
- Review widgets
Optimization Priorities:
- Optimize product images aggressively
- Lazy load images below fold
- Reserve space for dynamic pricing
- Use efficient carousels or galleries
- Cache product pages aggressively
News and Publishing Sites
Unique Challenges:
- Ad networks causing layout shift
- Related article widgets
- Social sharing buttons
- Comment sections
- Frequent content updates
Optimization Priorities:
- Reserve space for ads
- Lazy load article images
- Delay non-critical widgets
- Optimize featured images
- Consider server-side rendering
SaaS Applications
Unique Challenges:
- Heavy JavaScript frameworks
- Real-time updates
- Complex interactions
- Authentication systems
- Dashboard data loading
Optimization Priorities:
- Implement code splitting
- Use skeleton loading states
- Optimize critical rendering path
- Cache static assets aggressively
- Consider progressive web app patterns
Creating a Core Web Vitals Improvement Plan
1. Audit Current Performance
Use Multiple Tools:
- Google Search Console (identify failing pages)
- PageSpeed Insights (detailed diagnostics)
- Lighthouse (regular testing)
- WebPageTest (deep analysis)
Document Baseline Metrics: Record current performance for all three Core Web Vitals across key page types.
2. Prioritize Issues
Impact vs. Effort Matrix:
High Impact, Low Effort (Do First):
- Image optimization
- Enable caching
- Remove unused scripts
- Add image dimensions
High Impact, High Effort (Plan Carefully):
- Server infrastructure upgrades
- Framework changes
- Major architectural refactoring
Low Impact, Low Effort (Quick Wins):
- Font-display optimization
- Resource hints
- Minification
Low Impact, High Effort (Deprioritize):
- Minor code refactoring
- Marginal optimizations
3. Implement Changes Systematically
Phase 1: Quick Wins (Weeks 1-2)
- Implement image optimization
- Enable caching plugins
- Add explicit dimensions to images
- Remove obviously unnecessary scripts
Phase 2: Moderate Changes (Weeks 3-6)
- Optimize hosting/server configuration
- Implement lazy loading
- Optimize third-party scripts
- Add resource hints
Phase 3: Structural Changes (Weeks 7-12)
- Code splitting implementation
- Framework optimization
- Advanced caching strategies
- Service worker implementation
4. Monitor and Measure
Set Up Continuous Monitoring:
- Configure Search Console tracking
- Implement RUM (Real User Monitoring)
- Set up automated Lighthouse audits
- Create performance dashboards
Regular Review Cadence:
- Weekly: Check Search Console reports
- Monthly: Deep dive into analytics
- Quarterly: Comprehensive audit and strategy adjustment
5. Maintain Performance
Establish Performance Budget: Define limits and enforce them:
- Maximum page weight
- Maximum JavaScript bundle size
- Minimum Core Web Vitals scores
- Maximum number of requests
Build Process Integration:
- Automated Lighthouse checks in CI/CD
- Performance testing before deployment
- Reject deployments failing performance criteria
Team Training: Educate developers, designers, and content creators about performance impact of their decisions.
Author