

1. Introduction: Why Large Websites Need Advanced CRO
What this means (expanded):
Large sites have huge traffic; a 0.5% lift can equal millions in revenue. That makes CRO a high-leverage activity.
Complexity multiplies: thousands of pages, many templates, many audiences, many conversion points — so one-off fixes don’t scale.
CRO becomes a system (not a campaign): you need processes, roles, tools, governance, and repeatable methods.
Tactical takeaways:
Treat CRO as product work: include product managers, engineers, data teams.
Prioritize systemic improvements (tracking, templates, speed) before cosmetic A/B tests.
Establish ROI expectations: quantify revenue per visitor and use it to prioritize tests.
2. Characteristics of Large Websites
Detailed checklist & implications:
High Traffic (1M+ monthly)
Implication: you can segment heavily and still have statistical power. Enables more simultaneous tests.
Risk: even small bugs or regressions impact many users → require stronger QA and rollback plans.
Large number of pages (500–100k+)
Implication: changes must be applied via templates/components, CMS rules, or programmatic changes, not manual edits.
Action: maintain a template inventory (list of page templates, their uses, URLs, and variations).
Deep funnel structures
Implication: lots of micro-conversions; you must map and instrument each micro-step.
Action: maintain funnel maps per persona and per traffic source.
Multiple teams
Implication: alignment and governance needed; experiments compete with roadmap work.
Action: set a CRO steering committee and shared backlog.
Frequent updates & releases
Implication: tests must tolerate deploys and feature flags; release cadence can break tests or introduce bias.
Action: integrate CRO into release planning and use CI/CD friendly experiment infra.
3. Challenges in CRO for Large Websites (and mitigation)
Common problems + how to handle them:
Test velocity & concurrency
Problem: overlapping tests can interact and confound results.
Mitigation: audience split management, dependency tracking, and an experiment registry. Use full-factorial or holdout groups for cross-test interactions.
Template and consistency management
Problem: inconsistent UI across pages yields noisy data.
Mitigation: use component libraries (design system) and ensure experiments map to components.
Tracking and tag drift
Problem: analytics events get renamed, causing data loss.
Mitigation: implement a data contract (schema) for events; validate via automated tests; have a tag QA checklist.
Statistical significance issues for rare events
Problem: signups, enterprise leads, or high-ticket purchases are rare.
Mitigation: use sequential testing, Bayesian methods, or proxy metrics (e.g., demo requests, quote starts) validated to correlate with revenue.
Organizational friction
Problem: stakeholders override test decisions or delay shipping winners.
Mitigation: define decision rights in governance, communicate wins through a playbook, and require business-case for overrides.
High risk tests
Problem: a test may harm revenue.
Mitigation: use canary launches (small % of traffic), rapid rollback, and monitor revenue and key metrics in real-time.
4. CRO Strategy Framework for Enterprise-Scale Sites
(Deep dive on each pillar)
Research & Diagnosis (Quant + Qual)
Quant: funnel analysis, segmentation, cohort analysis, event quality checks. Tools: GA4/Adobe, BigQuery, Amplitude.
Qual: surveys, session recordings, heatmaps, usability tests, first-click tests. Tools: Hotjar, FullStory.
Deliverable: a prioritized diagnostic report with root causes and evidence for each problem.
Hypothesis Generation
Every hypothesis = Problem + Proposed Change + Expected Outcome + Metric.
Example: “Problem: PDP images poorly represent product → Change: Add 360° view + prominent thumbnail → Expected: +8% add-to-cart rate.”
Use templates for hypothesis briefs and tie to data.
Experimentation Strategy
Decide experiments by page template, funnel stage, or persona.
Build experiment backlog with dates, owners, CI/CD impact, and risk.
Use instrumentation playbooks (how to QA, telemetry to log, rollback steps).
Execution
Implementation: dev tickets, design comps, QA checklist (visual, analytics, accessibility, performance).
Launch: phased rollout, monitoring dashboards, alert thresholds.
Analysis: pre-registered analysis plan, statistical method, and post-hoc segmentation.
Scaling Optimization
Package wins into templates & component library changes—don’t just patch single pages.
Document lessons; maintain experiment archive and playbooks.
5. Step-by-Step CRO Process for Large Websites
Expanded operational steps, with deliverables and checks:
Step 1: Full CRO Audit (deliverable: Audit report)
Analytics Audit: Validate key events, conversion paths, event names, properties. Run automated tests to ensure event schema. Identify gaps in instrumentation.
Heatmap Analysis: Top pages, where users click, where they don’t. Pair with analytics to find high-traffic low-conversion pages.
Session Recording Review: Watch 50–200 sessions for each persona/traffic source to spot friction.
Website Speed Audit: LCP, FID, CLS — run Lighthouse and real-user metrics. Prioritize fixes.
Heuristic Review: Use known heuristics (Nielsen’s, Gestalt principles) to find glaring UX issues.
Checkout Funnel Review: Breakdown drop-off, step-by-step. Check payment gateways and third-party scripts.
Search & Filter Audit: Analyze searches with no results, filter conversions, and average time to result.
Mobile Review: Identify mobile-only issues (menus, sticky elements, click targets).
Step 2: CRO Measurement Plan (deliverable: Measurement spec)
Define primary/secondary/micro metrics for each funnel.
Create an event taxonomy (names, types, descriptions).
Define acceptable thresholds (expected variance, minimal detectable effect – MDE).
Step 3: Funnel Mapping (deliverable: Funnel maps)
Map major funnels per persona/source. Include drop-off points and event names.
For each funnel, define the win metric and success criteria.
Step 4: Deep segmentation
Build standard segments (device, geolocation, traffic source, new vs returning, logged-in status, product categories).
Use these segments in pre-launch power calculations (MDE per segment).
Step 5: Backlog & Roadmap
Prioritize using a scoring framework (ICE/PIE/PXL) and business impact modelling.
Publish a testing calendar and reserve capacity for urgent or experimental initiatives.
6. Data Infrastructure & Analytics Setup
Essentials and implementation notes:
Analytics tools: GA4 for broad reporting, Amplitude/Mixpanel for event-level user journeys, Adobe Analytics for enterprises requiring advanced segmentation. Use server-side analytics for reliable event capture (less ad-blocking noise).
Tag Management: Use GTM server-side or Adobe Launch. Implement environment separation (dev/staging/prod).
Experimentation Tools: Choose based on scale and integrations (Optimizely, VWO, LaunchDarkly for feature flags). Feature flags + server-side experiments reduce flicker and improve reliability.
Behavioral Tools: FullStory/Hotjar for session replay; choose one and integrate with analytics IDs to join behavior to events.
Data Warehouse & ETL: Capture raw events into BigQuery/Snowflake to enable cross-platform analysis and to build LTV models.
BI & Dashboards: Create executive dashboards and experiment dashboards for RRT (real-time telemetry) and post-test deep dives.
Data governance:
Define event taxonomy doc (name, description, owner).
Implement automated QA (synthetic tests) that assert event counts and schemas daily.
Version control analytics schema and make changes via PRs.
7. Creating a Scalable Experimentation System
Key components & playbook:
Experiment Registry: central table of active, planned, and archived experiments with owner, audience, pages, start/end, hypothesis, and risk level.
Experiment templates: standard test brief (problem, hypothesis, metrics, launch plan, rollback criterion).
Testing cadence: e.g., 2-week sprints for small UI tests; 4–8 week cycles for higher-risk changes.
Parallel testing rules: no overlapping changes to the same element or funnel unless explicitly modeled.
QA & rollout: visual QA, analytics QA, accessibility check, and performance impact test (Lighthouse before/after).
Reporting: standard statistical approach (pre-registration of primary metric, use of Bayesian or fixed horizon frequentist methods depending on rarity).
Knowledge library: winners, losers, learnings, and re-test recommendations.
8. Prioritizing CRO Across Thousands of Pages
How to score and pick experiments (process & formula examples):
Use PIE for quick prioritization:
Potential (0–10): estimated uplift
Importance (0–10): traffic or revenue weight
Ease (0–10): technical & design effort
Score = (P + I + E) / 3 or weighted
Use ICE when you want to emphasize speed:
Impact × Confidence × Ease
Use PXL (Peep Laja) for deeper scoring with more variables (urgency, frequency, link between cause & effect).
How to estimate business impact:
Compute the revenue per visitor (RPV) for target pages.
Estimate expected % lift from prior tests or benchmark.
Multiply traffic × baseline conversion × %lift × AOV = estimated revenue impact.
Prioritize tests with highest expected revenue impact per engineering day.
9. Designing Tests at Scale (templates & examples)
Per-template approaches & common test ideas:
Homepage
Goals: reduce bounce, increase exploration to category/product.
Test ideas: hero CTA copy, personalized modules (recommended categories), search prominence, top-nav simplification, urgency messaging.
Implementation notes: homepage affects many journeys; use canary rollouts and small % segments.
Category Pages
Goals: improve product discovery and “add-to-cart”.
Test ideas: filter prominence, sticky sort controls, product card CTA prominence, show stock indicators, sort defaults (best-selling vs price).
Implementation: run tests per top categories first and then generalize to templates.
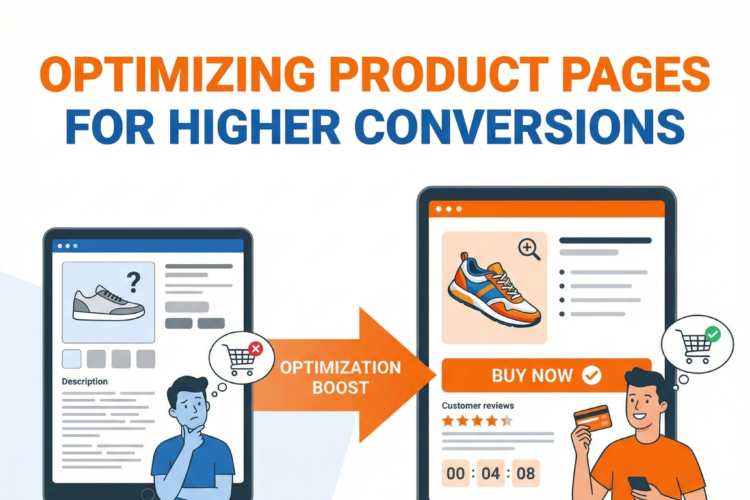
Product Detail Pages (PDP)
Goals: increase add-to-cart, reduce hesitancy, increase AOV.
Test ideas: add badges (fast shipping), price presentation, scarcity cues, reviews snippet, Q&A, image gallery layout, video placement, variant selection UX.
Implementation: map variations across devices; use server-side tests for complex variant pricing.
Cart & Checkout
Goals: reduce abandonment and friction.
Tests: guest checkout defaults, field reduction, inline validation, saved payment methods, express checkout options, shipping cost transparency, progress indicator clarity.
Implementation: always monitor revenue and payment gateway logs. Use canary rollout for payment-related changes.
Lead Forms & B2B Flows
Goals: increase demo requests or qualified leads.
Tests: progressive profiling, social proof, CTA microcopy, time-to-respond promises.
Implementation: validate leads with downstream CRM matching; measure quality (SQLs) not only volume.
10. Personalization at Scale
Types, triggers, and implementation approaches:
Rule-based personalization: simple if-then rules for geo, device, trending categories. Good first step.
Behavioral personalization: show content based on past views, category affinity, cart contents.
AI-driven personalization: collaborative filtering, content-based recommendations, session-level neural models.
Examples:
Returning users: “Recommended for you” with items viewed earlier.
Geo-targeted promos: display location-specific offers or payment methods.
Traffic-source-specific landing: different creatives and CTAs for paid vs organic.
Implementation: use recommendation engines (in-house or third-party like Dynamic Yield, Algolia Recommend, Amazon Personalize). Serve via APIs to ensure fast load.
Measurement: run A/B tests of personalization vs non-personalized experiences and measure incremental revenue.
11. CRO for Site Speed & Core Web Vitals
Why it matters: Speed impacts conversions and SEO. Large sites often have third-party scripts that slow down pages.
Key tasks:
Audit: field data (CrUX), lab data (Lighthouse), and waterfall traces.
Fixes: lazy-load offscreen images, preconnect critical resources, compress images (AVIF/WebP), minimize third-party tags, server-side rendering for heavy pages.
Monitor: set SLAs for LCP, FID, CLS by page template and enforce via CI/CD checks.
Performance QA: for every experiment, measure delta in Core Web Vitals and page load time before shipping widely.
12. CRO for Mobile-First & App-Integrated Websites
Mobile-specific principles:
Thumb-friendly design — CTAs within thumb reach.
Minimize modal/pop-up interruptions.
Use persistent bottom CTAs for high-value actions when appropriate.
Fast first-render: use skeletons to reduce perceived load time.
Use mobile payment options (UPI/wallets in India; Apple Pay/Google Pay globally).
App-integration:
For users who switch between app and web, harmonize experiences. Use deep linking from web to app for high-value flows.
Test messaging: “Open in app” vs continue on web — test which increases conversion.
13. Heatmaps, Session Recordings & Behavior Analytics for Large Sites
How to use them effectively:
Don’t use heatmaps as proof—use them for hypothesis generation. Always tie to analytics.
Sampling: for big sites, sample sessions for each key segment (mobile/desktop, logged-in/guest).
Patterns to watch: rage clicks (indicates broken elements), dead clicks (non-clickable elements that look clickable), low scroll in key content areas.
Session replay: watch sessions that match high-intent events (added to cart then dropped) to find friction.
14. User Research at Scale
Methods and how often to run them:
Usability testing: 5–10 users per persona per quarter for iterative tests.
First-click testing: tests to ensure users click where you expect on key funnels.
Surveys: targeted for exit intent or after checkout to understand hesitation.
Interviews & focus groups: deep insights on high-value customers (B2B buyers, power users).
Quant+qual integration: pair surveys with event data to weight voice-of-customer by business impact.
15. Conversion Funnels for Large Sites (Complex Funnel Mapping)
How to map and instrument:
Create funnel tree: top-level funnels (purchase, signup), subtree funnels (search → PDP → cart).
Instrument each stage with events, with properties that record context (source, campaign, SKU, price).
Calculate conversion rates per stage and per segment.
Identify high-impact drop-offs with both rate and revenue significance.
Example funnels to measure:
Paid campaign → landing → product → add-to-cart → checkout → payment
Organic content → email signup → nurture emails → demo request
16. Managing CRO for Multi-Country / Multi-Language Websites
Cultural & operational checklist:
Localize not only language but UX patterns (e.g., form layouts, address fields, unit systems).
Payment methods per country; test default payment order per locale.
Legal: regional cookie rules, consent banners; ensure experiments respect locale privacy.
Use geo-based feature flags to test localized variants and measure lift per country.
Maintain separate roadmaps per major market but share architecture & learnings.
17. CRO Toolkit for Large Websites (deeper)
Tool selection guidance:
Experimentation: Optimizely Full Stack or LaunchDarkly for server-side; Optimizely Web/Adobe Target for client-side.
Analytics: GA4 + event store + BigQuery for raw data.
Session replay: FullStory for heavy replay needs; Hotjar for quick heatmaps + polls.
Recommendations: Algolia Recommend, Dynamic Yield, or bespoke ML models served via API.
Data warehouse + BI: BigQuery + Looker/Looker Studio; Snowflake + Tableau.
Integration tips:
Centralize experiment metadata in data warehouse with experiment exposure logs.
Sync experiment exposure to analytics to enable accurate lift calculation.
Build a data pipeline that ties user_behavior → revenue events → CRM to measure LTV.
18. Building CRO Governance: Roles & Teams
Org chart & responsibilities:
CRO Lead / Head of Experimentation — strategy, prioritization, governance.
Data Scientist / Experimentation Analyst — power calculations, analysis plan, statistical modeling.
Product Manager / Growth PM — owns backlog and roadmap alignment.
Design Lead / UX Researcher — hypothesis formation, prototypes, user tests.
A/B Test Engineer / Frontend Engineer — implements, QA, rollback.
Analytics Engineer — data instrumentation, schema enforcement.
QA / Accessibility Specialist — validates visual, functional, and legal compliance.
Stakeholder Committee — approves high-risk tests and resource allocation.
Governance artifacts:
Experimentation handbook (standards, statistical approach, naming conventions).
Runbook for launches and rollbacks.
Monthly experiment review meeting with stakeholders.
19. How to Build a CRO Roadmap for 6 Months & 12 Months
Template roadmap with milestones:
Month 0 (Preparation): audit, fix analytics issues, set up experiment infra.
Months 1–3 (Quick wins): improve high-traffic page templates, run 10–50 low-risk tests.
Months 3–6 (Structural fixes): speed & CWV improvements, checkout redesign tests, personalization pilot.
Months 6–12 (Scale): implement recommendation engine, expand personalization, iterate on big redesigns, build A/B testing automation.
KPIs per milestone: MDEs, number of experiments, revenue per visitor improvement, reduction in drop-off at checkout.
20. Common Mistakes Large Websites Make in CRO (and how to avoid them)
Mistakes & fixes:
Too many simultaneous tests → Use registry and audience allocation.
Poor QA → Use automated visual regression, analytics smoke tests.
Not measuring long-term effects → Track downstream metrics (LTV, retention) not just immediate conversion.
Neglecting speed → Performance testing part of every experiment. Prioritize scripts causing layout shifts.
Ignoring segment-level effects → Present both aggregate and segmented results; apply winners appropriately.
21. KPIs & Metrics for Enterprise CRO
Primary KPI examples (how to measure & why they matter):
Conversion Rate (CR): visitors → desired action. Track by template & segment.
Revenue per Visitor (RPV): total revenue / total visitors. Aligns conversion with AOV.
Average Order Value (AOV): total order value / orders. Good for merchandising experiments.
Checkout Conversion Rate: cart → purchase. Key for transactional sites.
Secondary & supportive metrics:
Add-to-cart rate, cart abandonment, form abandonment
Engagement metrics: time on page, scroll depth, CTR on CTAs.
Operational metrics: page load time, error rates, tag firing rates.
Statistical rules:
Predefine primary metric and sample size.
Correct for multiple testing if many simultaneous experiments affect the same metric.
Use sequential or Bayesian approaches for long-running experiments.
22. Case Study Style Examples (how to structure and learn from them)
How to run a case study internally:
Problem statement (baseline metric & impact)
Hypothesis & rationale (data/qual support)
Test design (variants, sample allocation, segmentation)
Results (statistical detail + revenue impact)
Post-test actions (template changes, personalization rules)
Secondary learnings (unexpected segment effects, performance impacts)
Example (expanded):
eCommerce category layout change: baseline PDP conversion 2.4%, variant with prominent filter + smaller product cards → conversion 2.73% (+13%), revenue impact estimated at $X monthly; rolled into category template and applied to similar categories with AOV > threshold.
23. Final Recommendations & Next Steps (actionable checklist)
Immediate actions (first 30 days):
Run a measurement audit — fix top 10 tracking issues.
Create the experiment registry and backlog.
Run 3 quick experiments on high-traffic templates (homepage, top category, PDP).
Set up 1 dashboard for experiment monitoring and one for speed metrics.
Medium-term (3–6 months):
Implement server-side experiments or feature flags for critical flows.
Launch personalization pilot on returning users.
Fix top CWV issues for your top 10 revenue pages.
Long-term (6–12 months):
Build a recommendation engine tied to LTV modeling.
Institutionalize experimentation: team roles, monthly governance, archive of learnings.
Expand tests into retention and post-purchase experience.
Governance & culture:
Reward learning, not just wins.
Share a weekly experiment brief with stakeholders.
Keep a “playbook” of test ideas and proven patterns.
Appendices (practical templates & quick checklists)
Experiment brief template (copy/paste)
Title
Owner(s)
Page(s)/Template(s) affected
Problem statement (data-backed)
Hypothesis (If X, then Y, because Z)
Primary metric & secondary metrics
Audience & segments
Sample size/MDE & expected duration
QA checklist (visual, analytics, accessibility, speed)
Rollback criteria
Post-test actions
QA checklist (visual + analytics + dev)
Visual: pixel-diff ≤ threshold, correct on all breakpoints.
Analytics: exposure event recorded; all primary events firing.
Accessibility: aria labels, tab order, contrast ratio checks.
Performance: Lighthouse delta < acceptable threshold.
Legal: no GDPR/consent violations.
Quick conversion-impact calculator (manual)
Baseline CR × Traffic × AOV × expected lift (%) = Estimated monthly revenue impact.
Author