

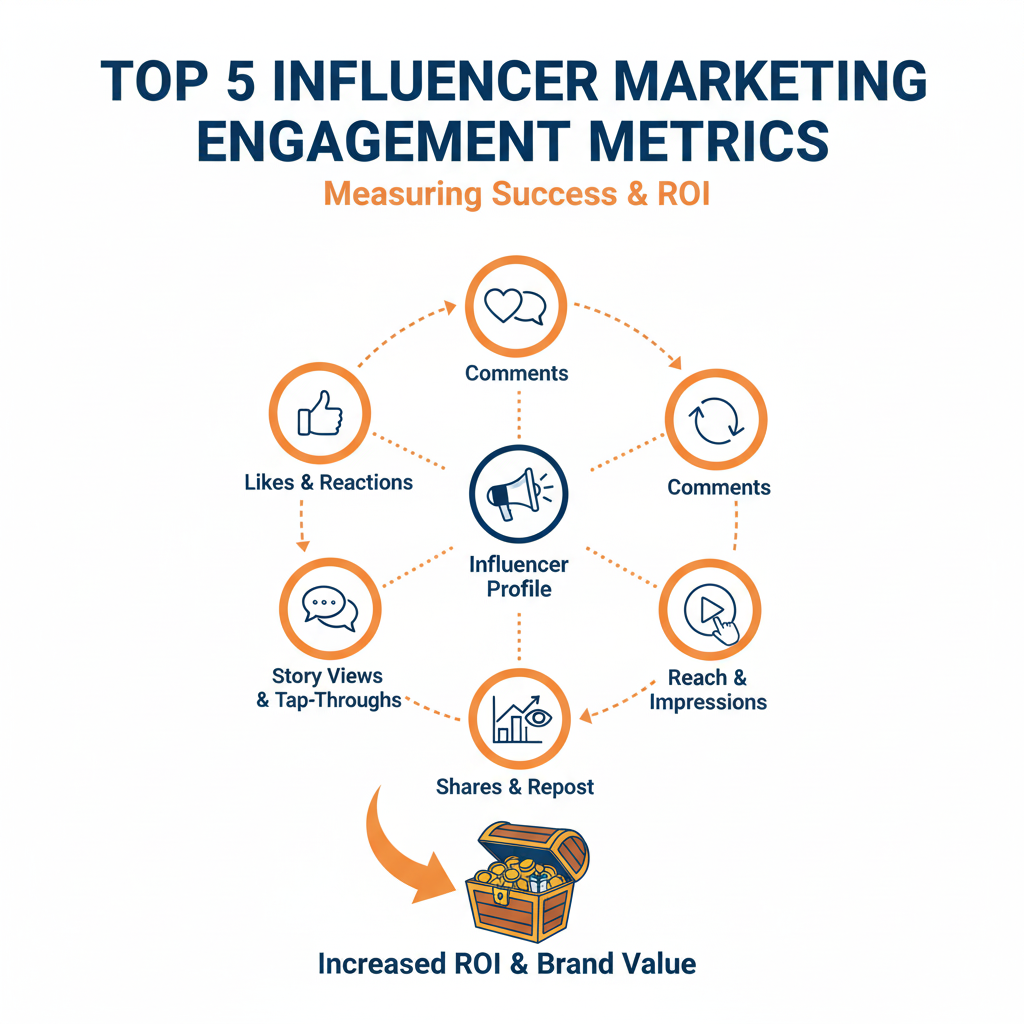
Top 5 Influencer Marketing Engagement Metrics & How to Track Them
Introduction
Influencer marketing has evolved far beyond vanity metrics like follower counts. In 2025, what truly determines success is engagement — how deeply audiences interact with influencer content, how much trust it builds, and how it drives measurable brand outcomes.
However, measuring engagement is no longer as simple as counting likes or comments. Today’s marketers must evaluate engagement quality, intent, and conversion potential across platforms like Instagram, YouTube, TikTok, and LinkedIn.
In this article, we’ll explore the top 5 influencer marketing engagement metrics, why they matter, and how to track them effectively using modern analytics tools and AI-driven insights.
Why Engagement Metrics Matter in Influencer Marketing
Before diving into the top metrics, let’s understand why engagement is the backbone of every influencer campaign:
-
It shows real audience connection, not just reach.
-
High engagement signals trust and credibility between influencer and audience.
-
Engagement data helps predict ROI — engaged audiences are more likely to click, convert, and stay loyal.
-
Algorithms on platforms like Instagram and TikTok reward engagement, boosting organic visibility.
In short:
“Engagement = Attention. Attention = Influence. Influence = Conversions.”
Top 5 Influencer Marketing Engagement Metrics (2025)
🧭 1. Engagement Rate
Definition:
Engagement rate measures how actively the influencer’s audience interacts with a piece of content relative to their follower count.
Formula:
Engagement Rate=(Likes+Comments+Shares+Saves)TotalFollowers×100\text{Engagement Rate} = \frac{(Likes + Comments + Shares + Saves)}{Total Followers} \times 100Engagement Rate=TotalFollowers(Likes+Comments+Shares+Saves)×100
Why It Matters:
It reveals how invested the influencer’s followers are. A high engagement rate suggests loyal, attentive followers rather than passive ones.
Ideal Benchmarks (2025):
| Platform | Average Engagement Rate |
|---|---|
| Instagram Reels | 3–6% |
| TikTok | 5–10% |
| YouTube | 2–4% |
| 1–3% | |
| X (Twitter) | 0.5–1.5% |
How to Track:
-
Use tools like HypeAuditor, Upfluence, or Sprout Social for real-time analytics.
-
For manual checks, calculate engagement on sample posts before finalizing collaborations.
-
Track trends: engagement over time, spikes, and drops.
Pro Tip:
Don’t just average engagement — analyze median engagement to avoid distortion by viral outliers.
2. Comment Quality & Sentiment Analysis
Definition:
Not all comments are equal. This metric evaluates the quality, tone, and intent behind comments on influencer posts.
Why It Matters:
An influencer might have 10,000 likes, but if comments are spammy (“Nice pic!” “Cool!”), real influence is low. Meaningful engagement comes from thoughtful, emotionally driven interactions.
How to Analyze:
-
Use AI sentiment analysis tools like Brandwatch, Emplifi, or Sprinklr to classify comments as positive, neutral, or negative.
-
Manually review top comments for authenticity and relevance.
-
Look for:
-
Questions → curiosity & interest.
-
Testimonials → credibility.
-
Product mentions → conversion potential.
-
Example:
If an influencer posts about your skincare brand and comments include:
“I’ve been using this for a month — love it!” or “Does it work on sensitive skin?”
That’s valuable engagement indicating awareness and purchase intent.
Pro Tip:
Score comments on a scale (1–5) for relevance and positivity to build a qualitative engagement index.
3. Share & Save Rate (Deep Engagement)
Definition:
This measures how often users save or share influencer content — an indicator of high-value, lasting engagement.
Why It Matters:
-
A save means the content resonated deeply enough to revisit later.
-
A share amplifies reach via organic word-of-mouth, the most trusted form of marketing.
-
It reflects content utility (educational, inspirational, or entertaining).
Formula:
Save/Share Rate=(Saves+Shares)Impressions×100\text{Save/Share Rate} = \frac{(Saves + Shares)}{Impressions} \times 100Save/Share Rate=Impressions(Saves+Shares)×100
Ideal Use Cases:
-
Educational content (e.g., financial tips, fitness routines, skincare routines).
-
Tutorials and “how-to” videos.
-
Inspirational quotes or life lessons.
Tracking Tools:
-
Instagram Insights, YouTube Analytics, or TikTok Business Dashboard.
-
Advanced tools like Later Analytics and Iconosquare for content-level breakdown.
Pro Tip:
Run A/B tests with influencers: compare carousel vs. video formats to see which gets higher saves and shares — optimize future briefs accordingly.
🎥 4. Click-Through Rate (CTR)
Definition:
CTR measures how many users clicked on your desired link (bio, story link, YouTube description, etc.) after viewing influencer content.
Formula:
CTR=ClicksTotalImpressions×100\text{CTR} = \frac{Clicks}{Total Impressions} \times 100CTR=TotalImpressionsClicks×100
Why It Matters:
CTR bridges the gap between awareness and action — showing if influencer content actually drives traffic to your landing page, app, or offer.
Ideal Benchmarks (2025):
| Platform | Average CTR |
|---|---|
| Instagram Story Swipe-Ups | 0.8–2% |
| YouTube Video Descriptions | 2–5% |
| TikTok Bio Links | 1–3% |
| LinkedIn Posts | 1–2% |
How to Track:
-
Use UTM parameters for every influencer link (e.g., via Google Campaign URL Builder).
-
Track in Google Analytics, HubSpot, or Bitly Analytics.
-
Create unique discount codes per influencer (e.g., “NITIN10”) to measure conversions beyond clicks.
Pro Tip:
Always align CTA (Call-to-Action) with campaign goals:
-
Awareness → “Learn More”
-
Consideration → “Watch the Full Video”
-
Conversion → “Shop Now” or “Book a Call”
💰 5. Conversion Rate & ROI (The Bottom Line Metric)
Definition:
Conversion rate shows how many people took a desired action (purchase, signup, download) after engaging with influencer content.
Formula:
Conversion Rate=ConversionsTotalClicks×100\text{Conversion Rate} = \frac{Conversions}{Total Clicks} \times 100Conversion Rate=TotalClicksConversions×100
Why It Matters:
It’s the ultimate performance indicator — showing not just engagement, but business impact.
Tracking Tools:
-
Use affiliate tracking links, promo codes, or post-purchase surveys (“How did you hear about us?”).
-
Integrate influencer platforms like GRIN, Impact.com, or Shopify Collabs for end-to-end attribution.
-
Combine Google Analytics and Meta Pixel for multi-touch tracking.
Pro Tip:
When analyzing ROI, don’t stop at direct sales — include:
-
Lifetime Value (LTV) of acquired customers.
-
Brand searches increase post-campaign.
-
Social follower growth attributed to influencer exposure.
ROI Formula:
ROI=(Revenue−CampaignCost)CampaignCost×100\text{ROI} = \frac{(Revenue – Campaign Cost)}{Campaign Cost} \times 100ROI=CampaignCost(Revenue−CampaignCost)×100
Bonus: Emerging Engagement Metrics in 2025
As influencer marketing becomes more data-driven, brands are adopting new-age engagement indicators:
-
Engaged View Rate (EVR): Percentage of viewers who watched >75% of a video.
-
Influence Score: AI-based score combining authenticity, reach, and engagement quality.
-
Follower Growth Impact: Change in brand’s followers during campaign.
-
Content Longevity: How long engagement sustains after posting (7-day vs. 30-day window).
-
Audience Overlap: Ensuring multiple influencers don’t target the same audience pool.
How to Build an Engagement Dashboard
A good influencer marketing dashboard should include:
| Metric | Tool | Frequency | KPI |
|---|---|---|---|
| Engagement Rate | HypeAuditor / Sprout Social | Weekly | >3% |
| Sentiment Score | Brandwatch | Weekly | 70%+ Positive |
| CTR | Google Analytics | Real-time | >1.5% |
| Conversion Rate | UTM + Shopify Collabs | Weekly | >2% |
| ROI | Custom Excel or Looker Studio | Monthly | >150% |
Automate with:
-
Google Looker Studio (connects with GA4 + Sheets)
-
HubSpot Marketing Hub
-
Airtable + Zapier integration for influencer performance tracking
Key Takeaways
| Insight | What It Means |
|---|---|
| Likes ≠ Loyalty | Focus on quality engagement, not surface metrics. |
| Track CTR & Conversions | These connect influencer activity to ROI. |
| Use UTM Links & Codes | Essential for attribution accuracy. |
| Analyze Sentiment | Positive emotion = higher conversion intent. |
| Build Dashboards | Real-time data drives better influencer selection and optimization. |
Conclusion
In 2025, influencer marketing success depends not on how many people see your brand — but on how meaningfully they engage with it.
Tracking engagement metrics like Engagement Rate, Sentiment, Saves/Shares, CTR, and Conversions helps marketers identify which influencers truly influence — not just entertain.
By combining these metrics with AI-powered analytics, you can turn influencer marketing from a creative experiment into a measurable growth engine that drives consistent ROI.
Author