
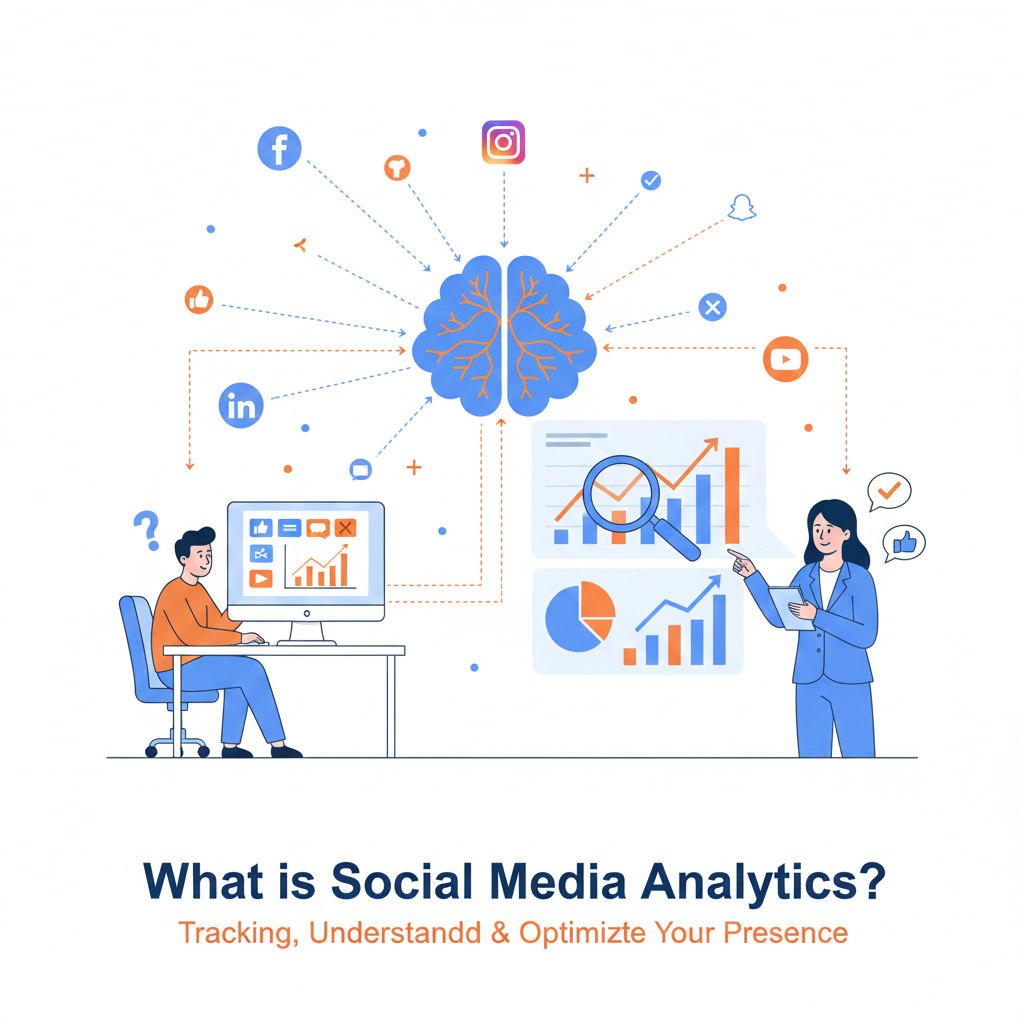
What is Social Media Analytics?
The Simple Answer
Social media analytics is the practice of collecting, measuring, and analyzing data from social media platforms to understand performance, audience behavior, and the impact of your social media activities. It transforms raw social media data—likes, shares, comments, followers, reach, and engagement—into actionable insights that help you make better decisions about your content, strategy, and business goals.
Think of it as your social media report card, but far more sophisticated. Instead of just knowing how many likes you got, social media analytics tells you who engaged with your content, when they were most active, what motivated them to interact, and how your social media efforts contribute to broader business objectives.
Why Social Media Analytics Matters
Moving Beyond Vanity Metrics
In the early days of social media marketing, success was often measured by simple counts: follower numbers, total likes, or shares. These “vanity metrics” feel good but don’t necessarily indicate business value. You might have 100,000 followers, but if none of them engage with your content or become customers, that number is essentially meaningless.
Social media analytics helps you dig deeper to understand:
- Engagement quality: Are people actually interacting with your content in meaningful ways?
- Audience composition: Who exactly is following and engaging with you?
- Content effectiveness: Which posts drive the actions you care about?
- ROI demonstration: How does social media contribute to revenue, leads, or other business goals?
- Competitive positioning: How do you stack up against competitors in your space?
Real Business Impact
Organizations use social media analytics to:
- Optimize content strategy by identifying what resonates with audiences
- Improve customer service by monitoring and responding to mentions and complaints
- Inform product development through sentiment analysis and customer feedback
- Identify influencers and advocates who amplify your message
- Measure campaign effectiveness with concrete data rather than guesswork
- Allocate budgets wisely by understanding which platforms and content types deliver results
- Prevent PR crises by catching negative sentiment early
- Drive sales by understanding the customer journey from social discovery to purchase
Key Types of Social Media Analytics
1. Performance Analytics
This examines how your content and accounts are performing:
Reach and Impressions
- Reach: The number of unique people who saw your content
- Impressions: Total number of times your content was displayed (includes multiple views by the same person)
These metrics show your content’s visibility and potential audience size.
Engagement Metrics
- Engagement rate: Percentage of people who interacted with your content (likes, comments, shares, clicks)
- Comments: Depth of conversation your content generates
- Shares/Retweets: How often people spread your content to their networks
- Saves/Bookmarks: Indicator of content people find valuable enough to reference later
- Click-through rate (CTR): Percentage of people who click links in your posts
Engagement metrics reveal how compelling and relevant your audience finds your content.
Follower Growth
- New followers: Rate at which you’re growing your audience
- Unfollows: People leaving your audience (high unfollows may indicate content misalignment)
- Net growth: Overall trajectory of your audience size
Video Metrics (for video content)
- View count: Total views
- Average watch time: How long people watch before scrolling away
- Completion rate: Percentage who watch the entire video
- Video engagement: Likes, comments, and shares specific to video posts
2. Audience Analytics
Understanding who your audience is and what they care about:
Demographics
- Age ranges
- Gender distribution
- Geographic location (countries, cities)
- Language preferences
- Income levels (on some platforms)
Psychographics
- Interests and hobbies
- Values and attitudes
- Lifestyle characteristics
- Purchase behaviors
Behavioral Patterns
- When they’re most active online
- Which devices they use (mobile, desktop)
- How they interact with different content types
- Their journey from discovery to conversion
Audience Overlap Understanding how your audiences intersect across different platforms helps create cohesive cross-platform strategies.
3. Competitive Analytics
Benchmarking your performance against competitors:
Share of Voice How often your brand is mentioned compared to competitors in your industry or niche.
Competitive Benchmarking
- How your engagement rates compare to competitors
- Follower growth comparisons
- Content strategy differences (what they post about, how often)
- Best-performing competitor content you can learn from
Gap Analysis Identifying opportunities where competitors aren’t serving audience needs that you could address.
4. Sentiment Analysis
Going beyond numbers to understand emotions and opinions:
Positive, Negative, and Neutral Sentiment Analyzing the tone of mentions, comments, and conversations about your brand. Are people saying good things, expressing frustration, or remaining neutral?
Emotion Detection More sophisticated analysis identifying specific emotions like joy, anger, sadness, surprise, or fear in social media conversations.
Issue Identification Spotting emerging problems or complaints before they escalate into larger issues.
Brand Health Tracking Overall perception of your brand over time through sentiment trends.
5. Conversion Analytics
Connecting social media activity to business outcomes:
Traffic and Referrals How much website traffic comes from social media platforms and which platforms drive the most visits.
Lead Generation Tracking how social media contributes to email signups, demo requests, or other lead capture activities.
Sales Attribution Understanding how social media touchpoints influence purchase decisions throughout the customer journey.
Customer Lifetime Value Comparing the long-term value of customers acquired through social media versus other channels.
6. Content Analytics
Deep dives into what content works and why:
Content Performance Comparison Identifying your best and worst performing posts to understand patterns in successful content.
Content Type Analysis Comparing performance across different formats:
- Images versus videos versus text posts
- Stories versus feed posts
- Live videos versus recorded content
- User-generated content versus brand-created content
Topic Analysis Which subjects, themes, or topics generate the most engagement and interest.
Hashtag Performance Which hashtags drive discovery and engagement, and which branded hashtags gain traction.
Optimal Posting Times When your specific audience is most likely to see and engage with content.
Essential Social Media Metrics Explained
Engagement Rate
One of the most important metrics, calculated as:
Engagement Rate = (Total Engagements / Total Followers or Reach) × 100
This shows what percentage of your audience actively interacts with your content. A high engagement rate indicates your content resonates strongly, while low engagement suggests misalignment between your content and audience interests.
Industry benchmarks vary widely by platform and sector, but generally:
- Instagram: 1-3% is average, 3-6% is good, 6%+ is excellent
- Facebook: 0.5-1% is average, 1-2% is good, 2%+ is excellent
- Twitter: 0.5-1% is average, 1-3% is good, 3%+ is excellent
- LinkedIn: 2-3% is average, 3-6% is good, 6%+ is excellent
Reach vs. Impressions
These are often confused but measure different things:
Reach tells you how many unique individuals saw your content. If 1,000 different people each saw your post once, your reach is 1,000.
Impressions count total views, including multiple views by the same person. If those same 1,000 people each saw your post twice, your impressions would be 2,000.
The ratio between impressions and reach indicates how often people see your content multiple times, which can indicate content staying power in feeds.
Click-Through Rate (CTR)
CTR = (Clicks / Impressions) × 100
This measures how effective your content is at driving action. If you’re posting to drive traffic to your website, product pages, or landing pages, CTR is crucial. It shows whether your messaging compels people to take the next step.
Follower Growth Rate
Growth Rate = (New Followers – Unfollows) / Total Followers × 100
This shows the percentage rate at which your audience is growing. A 5% monthly growth rate means you’re adding 5% to your follower base each month. This metric is more useful than absolute follower counts because it accounts for account size—gaining 100 followers means something different for an account with 500 followers versus 50,000.
Response Time and Rate
For customer service and community management:
Response Rate: Percentage of messages or comments you reply to Average Response Time: How quickly you typically respond
Fast response times and high response rates indicate active community management and customer care, which builds trust and loyalty.
Social Share of Voice (SSoV)
SSoV = (Your Brand Mentions / Total Market Mentions) × 100
This shows what percentage of the conversation in your industry or category is about your brand versus competitors. Growing share of voice indicates increasing brand awareness and market relevance.
Social Media Analytics Tools and Platforms
Native Platform Analytics
Every major social media platform provides built-in analytics:
Facebook Insights Offers demographic data, reach and engagement metrics, page and post performance, and audience activity patterns. Available for Facebook Pages and through Meta Business Suite.
Instagram Insights Provides follower demographics, content reach and engagement, profile activity, and story performance. Requires a business or creator account.
Twitter Analytics Shows tweet impressions, engagement rates, follower growth, top tweets, and audience interests.
LinkedIn Analytics Tracks company page performance, employee advocacy reach, content engagement, and visitor demographics for company pages.
TikTok Analytics Offers video views, follower growth, profile views, trending sounds, and audience demographics. Requires a Pro account.
YouTube Analytics Comprehensive data on watch time, audience retention, traffic sources, demographics, and subscriber growth.
Advantages: Free, platform-specific data directly from the source, easy access Limitations: Data stays within each platform, no cross-platform comparisons, limited historical data, basic analysis capabilities
Third-Party Analytics Platforms
Comprehensive tools that aggregate data across platforms:
Hootsuite Analytics Social media management with built-in analytics across multiple platforms, custom reporting, and team collaboration features.
Sprout Social Robust analytics with competitive analysis, social listening, and detailed reporting. Strong focus on ROI measurement.
Buffer Analyze Clean interface focused on essential metrics, story analytics, and easy-to-understand reporting for teams.
Brandwatch Advanced social listening and analytics with AI-powered insights, sentiment analysis, and image recognition.
Socialbakers (now Emplifi) AI-powered analytics with competitive benchmarking, influencer identification, and content inspiration.
Advantages: Cross-platform view, historical data retention, advanced analysis, competitive insights, automated reporting Limitations: Cost (can be significant for enterprise tools), learning curve, may not capture all platform-specific metrics
Specialized Analytics Tools
Google Analytics While not a social media tool per se, Google Analytics tracks social media referral traffic, conversion paths, and ROI for social media campaigns driving website traffic.
BuzzSumo Content research and analysis tool showing which content gets shared most, influencer identification, and topic trends.
Mention and Brand24 Social listening tools focused on brand mentions, competitor monitoring, and sentiment tracking across the web and social platforms.
Keyhole Hashtag and keyword tracking with real-time analytics, influencer identification, and campaign measurement.
How to Actually Use Social Media Analytics
1. Start with Clear Objectives
Before diving into data, define what you’re trying to achieve:
- Brand awareness: Focus on reach, impressions, follower growth, and share of voice
- Engagement: Track engagement rate, comments, shares, and conversation quality
- Lead generation: Monitor click-through rates, landing page conversions, and lead capture
- Customer service: Measure response times, resolution rates, and customer satisfaction
- Sales: Track conversion rates, revenue attribution, and customer acquisition costs
Your objectives determine which metrics matter most.
2. Establish Baselines and Benchmarks
You need context to understand whether your metrics are good or bad:
Internal Baselines Track your own performance over time. Is engagement increasing or decreasing? This shows whether you’re improving.
Competitive Benchmarks Compare your metrics to competitors. Are you ahead or behind in your industry?
Industry Standards Research average performance metrics for your industry and platform to understand where you stand.
3. Create a Regular Reporting Rhythm
Establish consistent analysis schedules:
Daily Monitoring Check for immediate issues, trending posts, and time-sensitive opportunities. This is about reactive management.
Weekly Reviews Analyze top-performing and underperforming content, engagement patterns, and follower growth. Adjust tactics based on what you learn.
Monthly Analysis Review overall performance against goals, identify trends, analyze audience growth and composition changes, and plan next month’s strategy.
Quarterly Strategic Reviews Deep analysis of long-term trends, competitive positioning, ROI assessment, and strategic adjustments for the next quarter.
4. Ask Better Questions
Instead of just looking at numbers, investigate the “why” behind them:
- Why did this post perform exceptionally well while similar content flopped?
- What do our best-performing posts have in common?
- Why are we losing followers after certain types of posts?
- Which audience segments engage most with different content types?
- How does performance vary by day of week or time of day?
- What external factors (events, seasons, news) influenced these results?
5. Turn Insights into Action
Analytics only create value when they inform decisions:
Content Strategy Adjustments If video content consistently outperforms images, shift more resources to video production.
Posting Schedule Optimization When you discover your audience is most active Tuesday and Wednesday evenings, schedule important posts for those times.
Audience Refinement If analytics show your actual engaged audience differs from your target audience, either adjust messaging to better reach targets or reconsider whether your current engaged audience represents a better opportunity.
Budget Reallocation Move resources from underperforming platforms or tactics to those driving better results.
Campaign Course Correction If campaign analytics show messaging isn’t resonating, adjust creative or targeting mid-campaign rather than waiting until it ends.
6. Test and Learn Continuously
Use analytics to run informal experiments:
- Post the same content at different times to find optimal posting windows
- Try different hashtag strategies and measure reach differences
- Test various content lengths, formats, and styles
- Experiment with different calls-to-action and measure click-through rates
- A/B test post copy, headlines, or images
Common Social Media Analytics Mistakes
Focusing Only on Vanity Metrics
Follower counts and likes feel good but don’t necessarily drive business results. A smaller, highly engaged audience often delivers more value than a large, passive one.
Ignoring Negative Data
When metrics decline, it’s tempting to ignore them or make excuses. The most valuable insights often come from understanding what isn’t working.
Not Segmenting Data
Averages hide important details. Your overall engagement rate might be mediocre, but one content type or audience segment might perform exceptionally well. Segmentation reveals these opportunities.
Comparing Across Platforms Inappropriately
Each platform has different user behaviors and expectations. A 2% engagement rate on Facebook and Instagram mean very different things. Compare performance to platform-specific benchmarks.
Analysis Paralysis
Don’t let perfect be the enemy of good. You don’t need to track every possible metric or have perfectly sophisticated analysis. Start with the basics, learn, and build complexity over time.
Short-Term Thinking
Social media success builds over time. One viral post is nice, but consistent performance and audience growth matter more. Look for trends rather than fixating on individual data points.
The Future of Social Media Analytics
Social media analytics continues evolving rapidly:
AI and Machine Learning Automated insight generation, predictive analytics forecasting future performance, and advanced sentiment analysis understanding nuanced emotions and sarcasm.
Integration with Other Data Sources Connecting social media data with CRM systems, sales data, customer service platforms, and offline behaviors for holistic customer understanding.
Privacy and Data Changes Platform privacy changes and regulations affect data availability, requiring analytics approaches to adapt while respecting user privacy.
Real-Time Analytics Faster data processing enabling immediate response to trends, crises, or opportunities as they emerge.
Visual and Audio Analysis Advanced AI analyzing images and video content to understand what visual elements drive engagement, and voice analysis for podcasts and audio social content.
Getting Started with Social Media Analytics
If you’re new to social media analytics, here’s a simple path forward:
- Set up native analytics on all platforms you use (Facebook Insights, Instagram Insights, etc.)
- Connect social platforms to Google Analytics to track website traffic and conversions
- Define 3-5 key metrics aligned with your primary business goal
- Create a simple weekly tracking spreadsheet to monitor these metrics consistently
- Review performance weekly and note what you learn
- Make one change based on your insights and measure the impact
- Build complexity gradually as you get comfortable with basic analysis
Author