The era of “spray and pray” advertising is over. In modern performance marketing, every dollar spent must be tracked, measured, and optimized against rigid unit economics. Whether you are scaling a direct-to-consumer (DTC) E-commerce brand, driving B2B SaaS pipeline, or acquiring users for a Fintech app, success is not dictated by vanity metrics like “impressions” or “likes.” It is governed entirely by mathematical formulas.
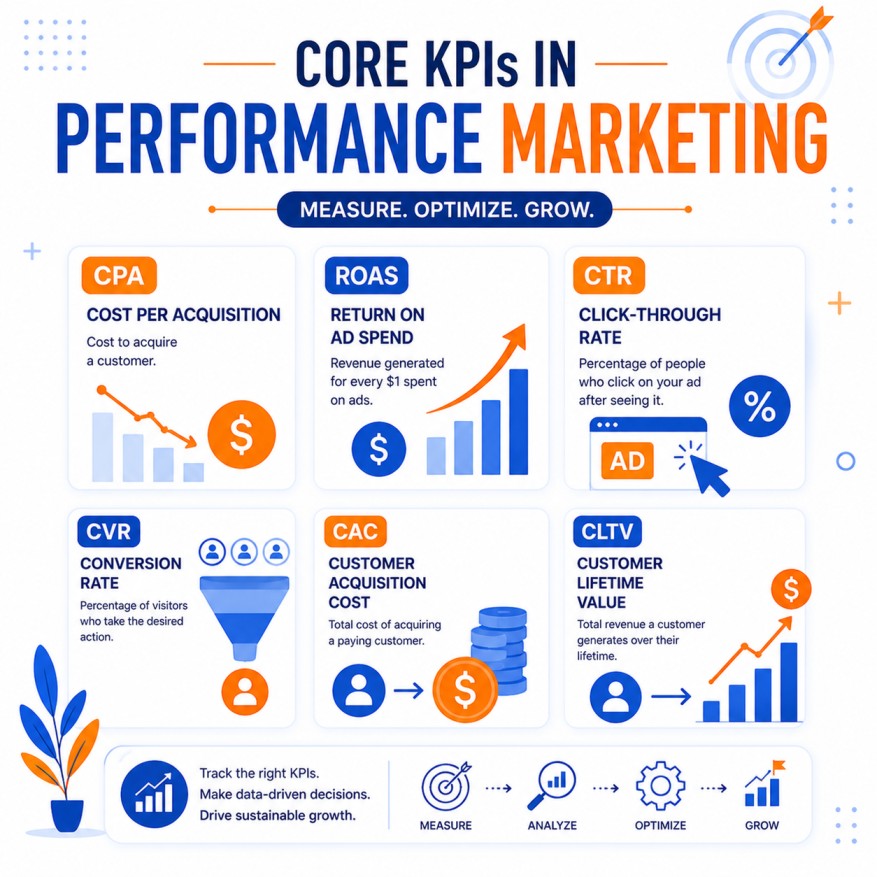
To master performance marketing, you must intimately understand the “Big Six” Key Performance Indicators (KPIs): CTR, CVR, CPA, ROAS, CAC, and CLTV. These metrics do not exist in isolation; they are an interconnected ecosystem that tells the complete story of your funnel’s health.
Here is the definitive, deep-dive guide into these core KPIs, how they are calculated, and how to optimize them to scale your business aggressively.
1. Click-Through Rate (CTR): The Top-of-Funnel Health Check
Click-Through Rate (CTR) measures the percentage of people who saw your ad and decided to click on it. It is the bridge between your advertisement (the impression) and your website (the visit).
The Formula
$$CTR=\left(\frac{TotalClicks}{TotalImpressions}\right)\times100$$
Why it Matters
CTR is the ultimate litmus test for relevance and creative resonance.
-
If your CTR is high, it means your ad creative is thumb-stopping, your copy is compelling, and your targeting is accurate.
-
If your CTR is low, the platform algorithms (Meta, Google, LinkedIn) will penalize you. Because platforms get paid when people click (or when they stay engaged), a low CTR signals a poor user experience, resulting in higher costs for your ads.
Strategic Context
-
Search vs. Social: CTR varies wildly by channel. A 5% CTR on Google Search (where intent is high) is standard, whereas a 1.5% CTR on Meta Ads (interruption marketing) is often considered excellent.
-
The Clickbait Trap: A high CTR is only valuable if the clicks are qualified. Using clickbait might spike your CTR, but it will decimate your downstream metrics (CVR and CPA).
2. Conversion Rate (CVR): The Friction Metric
Conversion Rate (CVR) measures the percentage of users who land on your page and complete the desired action (buying a product, submitting a lead form, downloading a whitepaper).
The Formula
$$CVR=\left(\frac{TotalConversions}{TotalVisitors}\right)\times100$$
Why it Matters
If CTR measures your ad’s ability to promise value, CVR measures your website’s ability to deliver on that promise. You can have the best media buying strategy in the world, but if your landing page has a slow load time, a confusing user interface, or an uncompetitive offer, your CVR will flatline, bleeding your budget dry.
Diagnostic Scenarios
-
High CTR + Low CVR: Your ad is writing checks your website cannot cash. There is a disconnect between the ad’s promise and the landing page experience (e.g., the ad promised a 20% discount, but the promo code wasn’t automatically applied at checkout).
-
Low CTR + High CVR: Your ad is hyper-niche or visually unappealing, but the traffic it does drive is wildly qualified. You need to focus on creative testing to broaden your appeal without losing intent.
3. Cost Per Acquisition / Cost Per Action (CPA)
Cost Per Acquisition (CPA)—sometimes called Cost Per Action—is the exact amount of ad spend required to generate one specific conversion.
The Formula
$$CPA=\frac{TotalCampaignAdSpend}{TotalConversions}$$
Why it Matters
CPA is your granular measure of campaign efficiency. Unlike CAC (which we will cover below), CPA usually refers to specific, campaign-level actions. An “acquisition” in this context isn’t always a paying customer; it could be an email subscriber, a webinar registrant, or an “Add to Cart” event.
Optimization Tactics
Lowering your CPA is the primary daily task of a media buyer. This is achieved by:
-
Pruning Waste: Excluding underperforming demographics, placements, or search terms.
-
Algorithm Feeding: Giving the ad platforms enough conversion volume (usually 50+ conversions per week) so their machine learning can optimize delivery and find cheaper conversions automatically.
4. Return on Ad Spend (ROAS): The Multiplier
Return on Ad Spend (ROAS) measures the gross revenue generated for every single dollar spent on an advertising campaign. It is the primary compass for E-commerce and direct-response marketers.
The Formula
$$ROAS=\frac{GrossRevenueFromAds}{TotalCostOfAds}$$
(Note: A ROAS of 3.0 means you make $3 in revenue for every $1 spent on ads).
Why it Matters
While CPA tells you what it costs to get an order, it doesn’t tell you the value of that order. ROAS solves this. If Campaign A generates customers at a $20 CPA and Campaign B generates customers at a $50 CPA, Campaign A looks better. But if Campaign B is selling high-ticket bundles and generating a 5.0 ROAS, while Campaign A only yields a 1.5 ROAS, Campaign B is the actual winner.
The “Break-Even ROAS” Crux
Many marketers blindly aim for a “high” ROAS without understanding their profit margins. You must know your Break-Even ROAS. If your gross margin on a product is 50%, your break-even ROAS is 2.0. Anything below 2.0 means you are losing money on the first sale, regardless of how many items you ship.
5. Customer Acquisition Cost (CAC): The True Business Metric
While CPA and ROAS measure ad platform efficiency, Customer Acquisition Cost (CAC) is a holistic business metric. It measures the total, fully-loaded cost of acquiring a new, paying customer.
The Formula
$$CAC=\frac{TotalSalesAndMarketingExpenses}{NewCustomersAcquired}$$
(Note: “Total Expenses” includes ad spend, software costs, agency fees, and the salaries of your marketing and sales teams).
| Metric |
CPA (Cost Per Action) |
CAC (Customer Acquisition Cost) |
| Scope |
Campaign-level / Platform-level |
Business-level (Blended) |
| Includes |
Ad spend only |
Ad spend, salaries, software, agency fees |
| Goal |
Optimize ad delivery & landing pages |
Understand total business scalability |
| Target |
Leads, clicks, or initial purchases |
Only net-new paying customers |
Why it Matters
CAC is what investors, CFOs, and founders look at. A platform might report a $30 CPA, but once you factor in the $10,000/month SEO agency, the HubSpot subscription, and the marketing director’s salary, your true CAC might be $150. If you don’t know your fully blended CAC, you cannot accurately forecast profitability.
6. Customer Lifetime Value (CLTV): The Spending Ceiling
Customer Lifetime Value (CLTV or LTV) is the total net profit a business can expect from a single customer over the entire duration of their relationship.
The Formula
$$CLTV=AverageOrderValue\times PurchaseFrequency\times AverageCustomerLifespan$$
Why it Matters
CLTV is the most critical metric for long-term growth. It dictates exactly how much you can afford to spend to acquire a customer (your CAC).
He who can spend the most to acquire a customer, wins. If your competitor has a CLTV of $500, they can comfortably afford a $150 CAC. If your CLTV is only $100 because your product breaks or your email retention strategy is terrible, you will be priced out of the ad auctions because you cannot afford the same CAC.
Increasing CLTV via upselling, cross-selling, loyalty programs, and exceptional customer service is often the fastest way to make your paid acquisition campaigns more profitable.
The Ultimate Equation: The LTV to CAC Ratio
The true mastery of performance marketing culminates in the relationship between your final two metrics: The LTV:CAC Ratio.
$$Ratio=\frac{LTV}{CAC}$$
This ratio acts as the ultimate speedometer for a business:
-
1:1 (Losing Money): It costs you exactly as much to acquire a customer as they will ever pay you. You are going bankrupt.
-
3:1 (The Goldilocks Zone): This is the industry standard for healthy, sustainable growth. For every $1 you spend acquiring a customer, you generate $3 in lifetime value.
-
5:1 or Higher (Too Conservative): While this looks highly profitable, it actually means you are under-investing in marketing. You are leaving market share on the table and should be spending much more aggressively to acquire customers faster.