
In the fast-paced world of e-commerce, where every click, scroll, and hover can mean the difference between a completed purchase and a lost sale, heatmap analysis has become an indispensable tool for understanding user behavior. With average cart abandonment rates still hovering around 70% and mobile shopping dominating traffic, simply relying on traditional analytics like bounce rates or session duration is no longer enough. Heatmaps provide visual, data-rich insights into exactly where users are engaging (or disengaging) on your site — revealing friction points, hidden opportunities, and behavioral patterns that drive real conversion lifts.
This exhaustive guide walks you through everything you need to know about conducting a professional heatmap analysis tailored specifically for e-commerce websites. We’ll start with foundational concepts, explore the different types of heatmaps, recommend the best tools available in 2026, provide a detailed step-by-step implementation process, dive deep into interpretation techniques for key e-commerce pages (homepage, product pages, category pages, cart, and checkout), share advanced use cases, integration strategies with other channels (SEO, remarketing, email campaigns, and more), optimization frameworks, real-world impact examples, common pitfalls, measurement of ROI, and forward-looking trends. By the end, you’ll have a complete, actionable playbook to turn raw behavioral data into measurable revenue growth.
What Is Heatmap Analysis and Why It Matters for E-Commerce in 2026
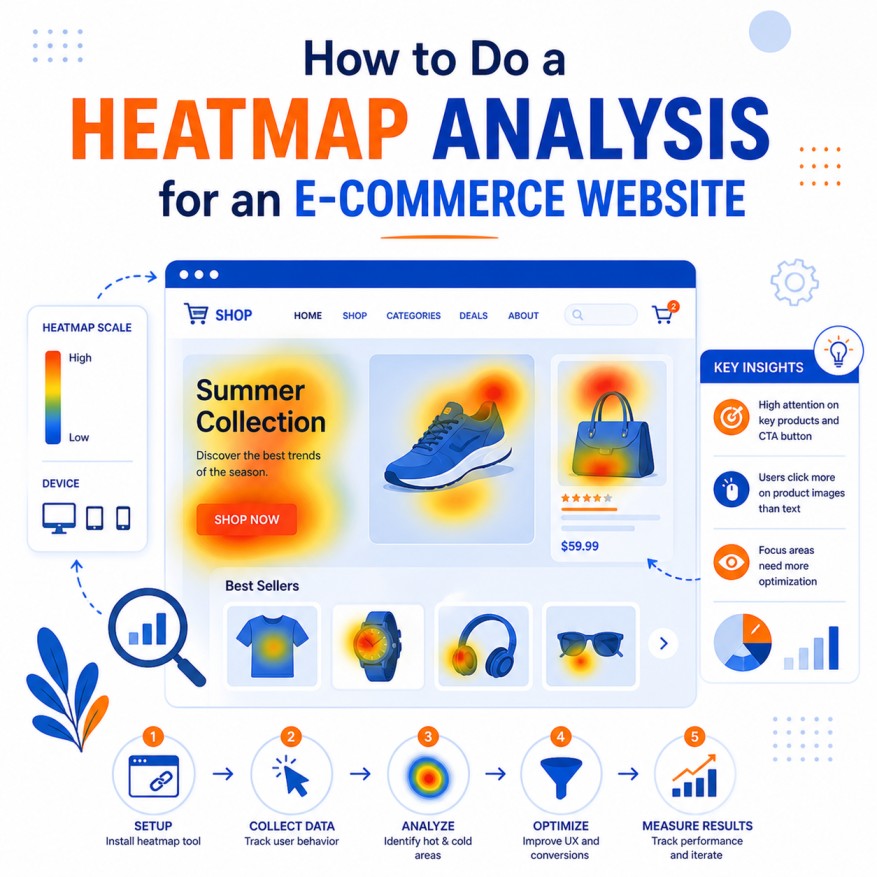
A heatmap is a visual representation of user interactions on a webpage, using color gradients (typically red for high activity, blue/cool tones for low activity) to show where visitors click, scroll, move their mouse, or fixate their attention. Unlike standard analytics that tell you what happened (e.g., 45% bounce rate), heatmaps reveal why it happened by mapping collective user behavior across thousands of sessions.
For e-commerce specifically, heatmap analysis is transformative because:
- It uncovers why users abandon carts (e.g., confusing checkout buttons or hidden trust signals).
- It identifies high-intent areas that aren’t being leveraged (e.g., users ignoring key product features or add-to-cart placements).
- It helps optimize for mobile, where 60%+ of traffic originates and experiences are often fragmented.
- It provides evidence-based decisions for A/B testing, reducing guesswork and accelerating conversion rate optimization (CRO).
- In a privacy-first, AI-driven landscape, heatmaps work with aggregated, anonymized first-party data, making them compliant and powerful even as cookies fade.
Businesses using heatmaps regularly report 10-30% lifts in key metrics like add-to-cart rates, checkout completion, and overall revenue per visitor. In 2026, with AI-enhanced heatmaps that predict behavior before it happens, this tool has evolved from a “nice-to-have” to a core part of any serious performance marketing and CRO strategy.
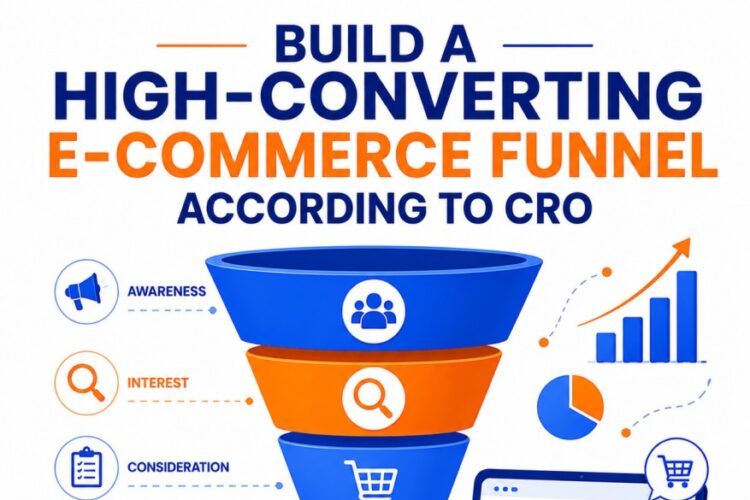
Types of Heatmaps: Choosing the Right Ones for Your E-Commerce Site
Not all heatmaps are created equal. Here are the main types and their e-commerce applications:
- Click Heatmaps Show where users click (or tap on mobile). Ideal for identifying popular CTAs, navigation confusion, or “dead clicks” on non-clickable elements.
- Scroll Heatmaps Visualize how far users scroll down a page and where they drop off. Critical for long product descriptions, category grids, or checkout flows.
- Mouse Movement (Hover) Heatmaps Track cursor movement as a proxy for attention. Useful for detecting interest in product images, reviews, or pricing sections.
- Eye-Tracking / Attention Heatmaps (AI-powered in 2026) Use computer vision and machine learning to predict gaze patterns without actual eye-tracking hardware. Excellent for homepage hero sections or product galleries.
- Frustration Heatmaps (or Rage Click / Error Click) Highlight areas causing irritation — rapid clicking, shaking the cursor, or back-button usage. Gold for checkout and form optimization.
- Mobile-Specific Heatmaps Separate views for touch interactions, pinch-to-zoom, and orientation changes.
- Session Replay Heatmaps (hybrid) Combine heatmaps with video-like replays of individual sessions for qualitative depth.
Smart e-commerce teams use a combination — typically click + scroll + frustration — to get a 360-degree view.
Best Heatmap Tools for E-Commerce in 2026
The landscape has matured with privacy-compliant, AI-integrated solutions:
- Hotjar — Still a leader with easy setup, session recordings, and incoming AI insights.
- Microsoft Clarity — Free, powerful, with built-in heatmaps, recordings, and excellent rage-click detection.
- Crazy Egg — Strong for click and scroll maps with A/B testing integration.
- FullStory — Enterprise-grade with advanced segmentation and quantitative + qualitative analysis.
- Contentsquare or Quantum Metric — For large-scale sites needing omnichannel and predictive analytics.
- AI-Native Tools (emerging leaders like Glassbox or new 2026 entrants) — Use machine learning to auto-detect anomalies and suggest fixes.
Choose based on budget, site traffic volume (aim for tools handling 10,000+ sessions/month), and integration with your stack (Shopify, BigCommerce, WooCommerce, or custom).
Step-by-Step Guide: How to Set Up and Run a Heatmap Analysis
Step 1: Define Objectives and Scope Start with clear questions: “Why is our mobile checkout abandonment so high?” or “Are users finding the add-to-cart button on product pages?” Identify 5-8 priority pages (homepage, top product pages, category pages, cart, checkout, blog if relevant).
Step 2: Choose and Install the Tool
- Sign up and add the tracking script via Google Tag Manager (recommended for flexibility) or direct code injection.
- Enable necessary permissions and ensure GDPR/CCPA compliance (anonymized data, consent banners).
- Set sampling rates if traffic is very high (e.g., 20-50% of sessions).
Step 3: Configure Data Collection
- Segment by device (desktop vs. mobile), traffic source (organic, paid, direct), user type (new vs. returning), and behavior (e.g., cart abandoners only).
- Set recording triggers for key pages only to control data volume.
- Run the analysis for a minimum of 2-4 weeks or 5,000-10,000 sessions per page for statistical significance.
Step 4: Collect and Segment Data Activate the tool and monitor initial data flow. Create custom segments (e.g., “high-value visitors who viewed 3+ products”).
Step 5: Analyze the Heatmaps Dive into each page type (detailed below). Look for patterns, not isolated anomalies.
Step 6: Generate Insights and Hypotheses Turn observations into testable ideas (e.g., “Moving the trust badges higher will reduce scroll drop-off”).
Step 7: Test, Implement, and Iterate Run A/B tests on changes, then re-run heatmaps to measure impact. Make this a recurring monthly process.
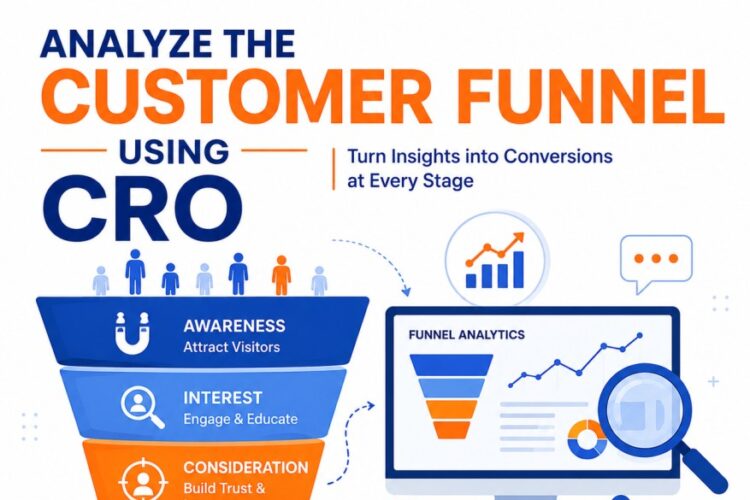
Interpreting Heatmaps: Page-by-Page Deep Dive for E-Commerce
Homepage Analysis
- Look for hero banner clicks vs. actual engagement.
- Check if navigation menu gets ignored or if promotional banners steal attention from category links.
- Scroll maps should show strong drop-off after the fold — optimize by moving key CTAs higher.
Product Page Analysis
- Click maps: Is the add-to-cart button hot? Are users clicking on images, size selectors, or reviews?
- Scroll maps: Do people read descriptions or bail early?
- Hover maps: High activity around price or shipping info indicates interest (or confusion).
- Frustration signals: Rapid clicks on “out of stock” or variant selectors point to UX issues.
Category / Collection Pages
- Grid layout heatmaps reveal which products get the most attention.
- Filter usage: Low clicks on filters suggest poor placement or confusing options.
- Infinite scroll vs. pagination: Scroll maps show if users reach the end or give up.
Cart Page
- High clicks on “remove item” or coupon fields may indicate regret or sticker shock.
- Scroll maps often show users never reaching the “proceed to checkout” button if the page is too long.
Checkout Page
- Critical for abandonment reduction. Look for rage clicks on form fields, shipping options, or payment gateways.
- Attention maps: Do users fixate on security badges or total price?
- Mobile checkout heatmaps are especially revealing — tiny buttons or poor form design show up immediately.
Additional Pages
- Account/login pages, blog posts (for content-driven traffic), and thank-you pages for post-purchase upsells.
Cross-reference with session replays for context: a cold area on a heatmap might actually be a confusing element that users actively avoid.
Advanced Use Cases and Integration with Broader Strategies
- Reducing Cart Abandonment: Combine heatmap data with remarketing audiences (target users who hovered but didn’t click “checkout”).
- SEO Synergy: Use scroll and attention data to optimize on-page content length and placement for better dwell time and rankings.
- Newsletter and Email Alignment: Heatmap insights on what content users engage with can inform newsletter topics or campaign offers.
- Influencer Content: Test landing pages built from influencer-driven traffic to see if the messaging resonates.
- A/B Testing Powered by Heatmaps: Before/after comparisons validate design changes.
- Personalization at Scale: Segment heatmaps by customer cohorts (e.g., first-time vs. loyal) to tailor experiences.
- Mobile-First Optimization: Isolate mobile heatmaps to fix thumb-friendly navigation and speed issues.
Optimization Framework: Turning Insights into Revenue
- Prioritize Quick Wins — Fix obvious friction (dead clicks, hidden buttons).
- Hypothesis-Driven Changes — Document every insight with expected impact.
- Quantitative + Qualitative Loop — Pair heatmaps with surveys or on-site polls.
- Benchmark Against Industry Standards — Compare your heatmaps to category averages.
- Automate Where Possible — Use AI tools that flag anomalies automatically.
- Cross-Functional Collaboration — Share findings with design, dev, and marketing teams.
Typical results: 15-25% improvement in key page conversion rates after 2-3 optimization cycles.
Measuring ROI and Proving Impact
Track before-and-after metrics:
- Conversion rate and revenue per session on analyzed pages.
- Cart abandonment and checkout completion rates.
- Time on page and scroll depth.
- A/B test statistical significance.
- Overall site-wide lifts attributable to heatmap-driven changes.
Calculate ROI by comparing implementation cost (tool subscription + dev time) against incremental revenue. Many brands see payback within weeks.
Common Challenges and How to Overcome Them
- Data Overload: Solution — Start narrow (3-5 pages) and use filters aggressively.
- Sample Size Issues: Solution — Run longer or focus on high-traffic pages.
- Privacy Concerns: Solution — Choose compliant tools and communicate transparently.
- Misinterpretation: Solution — Always validate with session replays and other analytics.
- Implementation Resistance: Solution — Present data visually with clear revenue projections.
- Seasonality Bias: Solution — Compare same-period data year-over-year.
Real-World Impact: Generalized Success Patterns
E-commerce brands across fashion, electronics, beauty, and home goods consistently report:
- 20-40% reduction in checkout friction after relocating key elements based on heatmaps.
- Significant lifts in add-to-cart rates by optimizing product page layouts.
- Lower bounce rates on category pages through better visual hierarchy.
- Higher mobile conversions after fixing tap-target issues revealed by touch heatmaps.
One recurring pattern: Brands that combine heatmaps with remarketing and SEO see compounding effects — better on-site experience feeds stronger organic rankings and more efficient paid re-engagement.
The Future of Heatmap Analysis in 2026+
AI is supercharging everything: predictive heatmaps forecast behavior, automated insight reports suggest fixes, and integration with computer vision allows “zero-party” attention prediction. Expect tighter connections with unified analytics platforms and real-time personalization engines. As voice and visual search grow, heatmaps will expand beyond traditional web to app and AR shopping experiences.
Conclusion: Make Heatmap Analysis a Core Habit for E-Commerce Growth
Heatmap analysis is far more than a visualization tool — it’s a window into your customers’ minds that removes guesswork from website optimization. By systematically setting up tracking, interpreting data page-by-page, turning insights into hypotheses, testing rigorously, and iterating continuously, you can create frictionless shopping experiences that convert more visitors into loyal buyers.
Start today: Pick your top three problem pages, install a reliable tool like Microsoft Clarity or Hotjar, gather two weeks of data, and schedule your first analysis session. Involve your team, document everything, and tie every change back to revenue impact. In 2026’s competitive landscape, the e-commerce winners aren’t just driving more traffic — they’re obsessing over how that traffic actually behaves once it lands on the site.
Master heatmap analysis, and you’ll unlock hidden conversion potential you didn’t even know existed. Your website will stop being a black box and become a data-driven growth engine that compounds month after month. The tools, techniques, and opportunities are ready. The only question left is how quickly you implement them — because every unanalyzed session is a missed opportunity for more sales and happier customers. Begin your heatmap journey now, and watch your e-commerce performance transform.
Author